A liquidity analysis of our technology growth holdings.
After years of stimulus and low interest rates, the Federal Reserve has tightened its monetary policy. This has shortened investor time horizons and brought into focus current profitability versus future profitability. When capital is cheap and abundant (e.g., 2021), hurdle rates tend to be lower and companies can easily raise funds. This can result in an environment where companies have a long leash in terms of demonstrating profitability and cash flow. Many companies used this environment to grow at any cost and with no regard to profitability. With capital now more restricted, companies that exercised poor capital discipline may now find themselves lacking capital and needing to rethink their business models.
A cautionary tale is auto retailer Carvana, an online dealer of used vehicles in the United States. In 2021, Carvana more than doubled its revenue to $12.8B on the sale of 425k cars and its share price reached a high of $376. At a high level, the Carvana business model is attractive; why go to a dealer, when Carvana will deliver a refurbished car to your home and let you test drive it for a week before deciding on purchase. However, as the company has scaled its business, it has also been operating at a massive cash flow loss. Last year it lost $2.6B in operating cash flow and had to rely heavily on debt financing to grow. It is likely that Carvana’s growth is in part driven (no pun intended) by taking a lower margin spread on vehicles (either outbidding other dealers for inventory and/or selling at a lower price). Whatever the cause of its cash flow issues, Carvana’s shares have fallen over 90% in the last year as the used car market slowed and interest rates began to rise. Carvana, despite its promising business plan, must now decide between growth or survival.
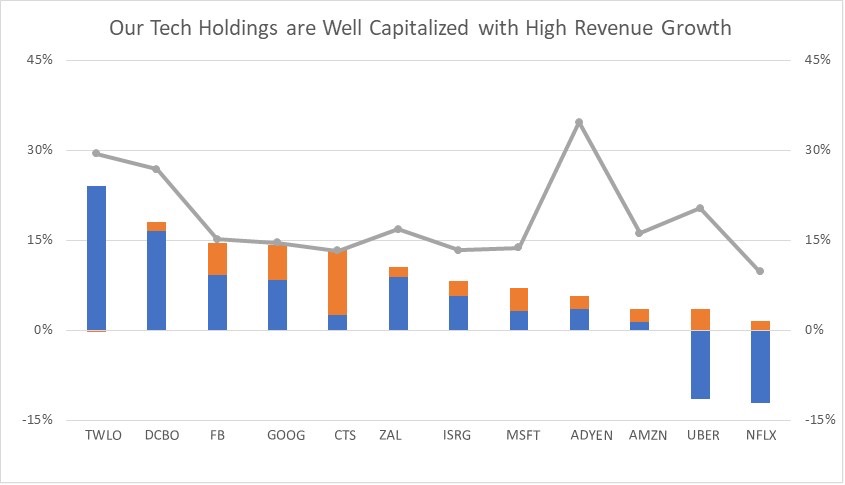
Capital allocation analysis is an important part of our process at MWG, and we continually monitor the liquidity of our portfolio companies. With the topic more timely given the changes in interest rates, we decided to present a framework for analyzing a company’s liquidity. We focus on three metrics we believe capture the balance between growth and liquidity: revenue growth, net debt and free cash flow (Figure 1).
Revenue growth (grey line) – The expected revenue growth of the company in the next two years.
Free Cash Flow yield (orange bar)– How much free cash flow will be generated as a % of market capitalization in the next year.
Net Debt (cash) (blue bar) – Net debt (or net cash when cash is greater than debt) provides a company’s total debt (or cash) in relation to its market cap. Most companies on the graph below have net cash. Remember, most companies also have some debt to optimize their capital structure. In the case of Uber and Netflix, their net debt does not pose much financial risk given the low level but does not provide the same operating flexibility as companies in a net cash position.
We have combined the blue and orange bars to get a sense of each company’s available cash resources over the next year. If the market weakens further, companies can use this flexibility to make strategic acquisitions at low prices or buy back shares at attractive levels.
Figure 1: Technology Holdings Framework

To illustrate, we will use Alphabet (GOOG), owner of Google and YouTube. From the chart, we can see that GOOG should grow its revenue about 14% next year. The blue bar represents the cash on the balance sheet, $125B, divided by its $1.4T market cap (about 8%). The orange bar represents GOOG’s forecasted $84B of free cash flow (6% of market cap). Summed together the two numbers equal 14%.
We believe this framework shows the financial strength of our technology portfolio. A strong financial position allows a company to re-invest through economic cycles and often benefit from recessions as they take market share from weaker competitors. We apply a similar level of scrutiny to all of our companies and do not believe their balance sheets suffer from any outsized financial risk.
This Focus Stock is written by our Head of Research, Jamie Murray.
The purpose of this is to provide insight into our portfolio construction and how our research shapes our investment decisions. As always, we welcome any feedback or questions you may have on these monthly commentaries.

