By: Michael Hakes, CFA, MBA
The current market, with a few technology giants driving U.S. equities to record highs and the excitement surrounding Artificial Intelligence (AI), has led many to question whether we are seeing a repeat of past irrational exuberance, or if this rally is built on a solid foundation. In our view, a financial bubble is defined by rapidly rising asset prices, extreme valuations disconnected from profits and increased systemic risk. The central thesis of this analysis is that the current bull market is being primarily propelled by an extraordinary expansion in corporate earnings and cash flow rather than a widespread investment in unprofitable ventures.
Today’s market’s leaders, which now account for 40% of the index’s market capitalization, possess immense financial strength and are funding innovation sustainably through their own cash flow, establishing a crucial anchor to value. The engine of this growth is clearly the “Magnificent 7” ,which in 2023 were responsible for the entirety of the S&P 500’s net earnings growth; without them, aggregate earnings would have been negative. This highlights that the market’s strength is not from broad-based speculation, but a concentrated surge in the profitability of a select few dominant enterprises. This two-tiered market indicates that the primary vulnerability of today’s market is a downturn in a few key names rather than the systemic froth of a speculative bubble.
Valuations Under the Microscope
While the market is fundamentally underpinned by strong earnings growth, its valuations are undeniably elevated by historic standards. The S&P 500’s forward 12-month price-to-earnings (P/E) ratio stands at approximately 22x, well above its 25-year average of around 16x-18x and only slightly below the peak forward P/E of roughly 25x recorded in March 2000.
There is a critical distinction, however, and that is in the valuation of the leading companies. Today, the “Magnificent 7” trade at a median forward P/E of approximately 27x. In March 2000, the top tech stocks traded at an average P/E of 52x (Figure 1). Furthermore, when adjusted for growth using the Price/Earnings-to-Growth (PEG) ratio, the current market appears far more rational. The S&P 500’s current PEG ratio is approximately 1.7x, less than half the 3.7x recorded at the height of the 2000 bubble. This lends credence to the fact that while P/E ratios are elevated, they are supported by exceptionally strong forward earnings growth estimates.
Figure 1. Comparison of valuation today versus bubbles
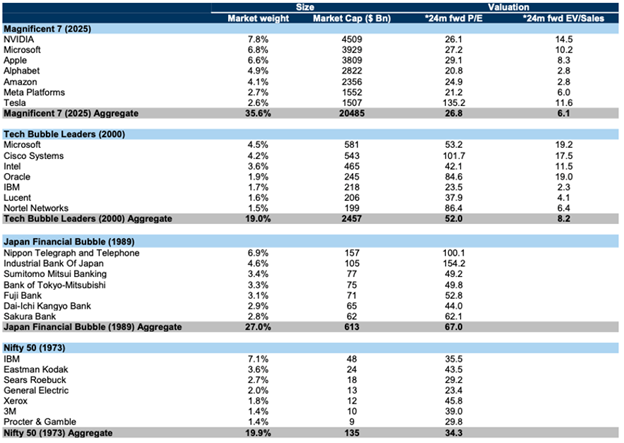
Source: Goldman Sachs Research
Fortress Balance Sheets: The Financial Strength of Market Leaders
A defining feature of a speculative bubble is the proliferation of financially weak companies. Today’s dominant technology firms are the opposite, characterized by exceptionally strong balance sheets, high levels of profitability, and the prodigious generation of free cash flow. In 2024, the aggregate net profit margin for the Magnificent 7 was an extraordinary 28%, vastly superior to the 16% margin of the leading tech firms back in 2000.
The cash flow being generated by these companies allows them to fund their own innovation. The current AI revolution is demanding hundreds of billions of dollars in investment, but unlike past booms, which were financed by speculative debt, this cycle is being financed almost entirely by internal operating cash flows. The “Big 4” cloud and AI leaders (Microsoft, Amazon, Alphabet/Google and Meta/Facebook) are projected to generate over $200 billion in free cash flow (i.e., cash flow after accounting for their massive capital expenditures) in 2025. This self-funded model is inherently more stable and less prone to the systemic shocks that burst previous bubbles. Figure 2 provides the aggregated levels of capital spending (capex) and EBITDA (short hand for cash flow) and the proportion of EBITDA that is allocated to capex. As illustrated, there is ample cash flow to fund their capex requirements and then some.
Figure 2. While capital spending has accelerated, it remains well below internal cash generation levels
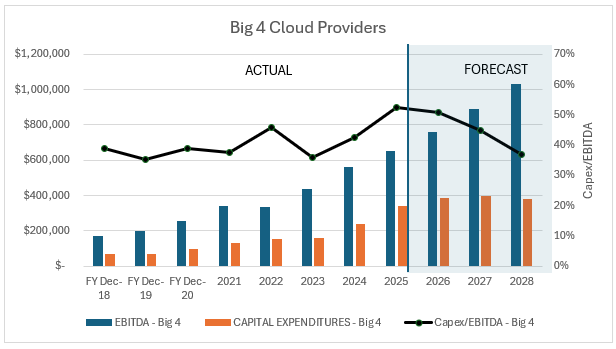
Source: MWG, Refinitiv Workspace
Conclusion
Our analysis leads to a clear conclusion: while the market is expensive and concentrated, it does not have the defining characteristics of a speculative bubble. The rally is anchored in the tangible and substantial earnings of its leading companies. Valuations are stretched by historic standards, but are supported by strong growth prospects. Crucially, the market’s leaders possess immense financial strength and are funding innovation sustainably through their own cash flows, reducing systemic risk.
The current environment can perhaps best be described as a fundamentally driven, albeit concentrated and expensive by historic standards bull market. The primary risks are a potential slowdown in the earnings growth of the mega-cap leaders or a significant regulatory challenge to their market power. Therefore, we believe investors should remain optimistic, but also mindful of the market’s fundamental strengths and the unique risks created by its concentration. We continue to be well positioned for ongoing AI and digital transformation, with 35% of our holdings in the MWG Global Equity Growth Fund directly benefitting from the massive investment in AI. All are highly profitable, generate substantial cash flow and are well positioned for the future.