Aritzia: A look at its Lifecycle so far and what the future holds
Aritzia (ATZ-TSX) is a company we have held in our Global Equity Growth Fund since 2018. In our initial report, we compared Aritzia’s U.S. growth opportunity to that of Lululemon, given their similarities in target market and Direct-To-Consumer approach. As Aritzia has proven successful in gaining U.S. market share (revenue has grown at a 41% CAGR), we are extending our analysis to other successful retail growth brands by comparing Aritzia with not only Lululemon (LULU – NASDAQ) but Inditex (ITX – MC). ITX is a Spanish-based global apparel and accessory retailer with a collection of seven brands, most notably Zara, and 2021 revenue totalling €27B . Other ITX brands include Bershka, Massimo Dutti, Pull & Bear, Stradivarius, Zara Home and Oysho.
Looking through LULU’s and ITX’s history, we believe that Aritzia is at a similar point in its lifecycle to LULU and ITX back in 2015 and 1999, respectively, and will follow the same growth trajectory as these two successful retailers. Aritzia’s success will be driven by its increasing profitability, its ability to generate free cash flow, its strong eCommerce channel, its continuous product innovation and its strategic U.S. expansion. These factors support a CAGR of revenue of 23%, indicating ATZ could reach $3B in revenue by 2026 and $5B by 2028. This would translate into EPS of $3.33/$6.13 in 2026/28, which implies a share price of $75/$138, respectively, based on its current P/E multiple of 22.5x
Throughout this report, we will attempt to normalize historical financial metrics of the three companies by scaling the x-axis of the graphs to represent the companies at a base level that represents a similar level of revenue generation for all three. Aritzia’s FY2023 revenue of $1.8B is similar to LULU’s revenue in 2015 and ITX’s revenue in 1999, as shown in the table below. We will consider these years (2023 for ATZ, 2015 for LULU and 1999 for ITX) as Year 0 (Y0) for the respective companies.
Figure 1: Aritzia’s FY2023 financial profile is similar to LULU in 2015 and ITX in 1999

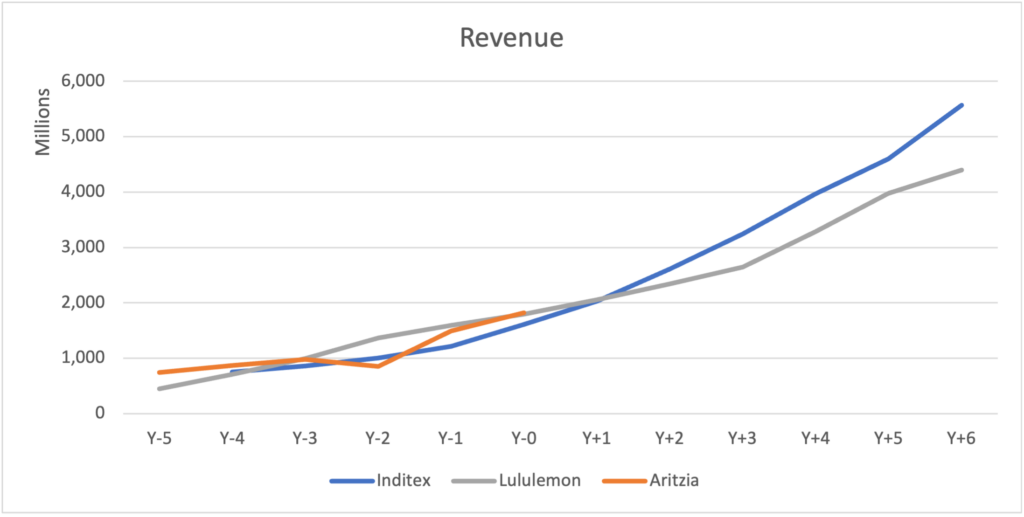
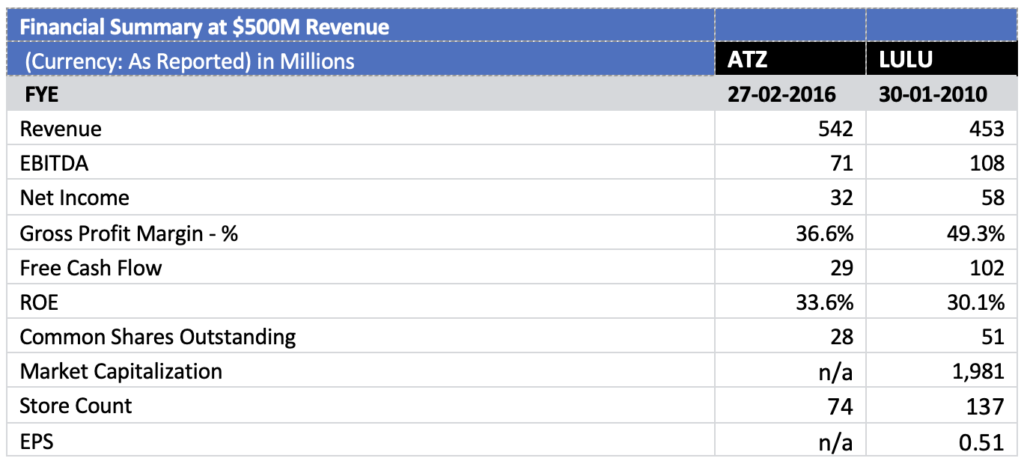
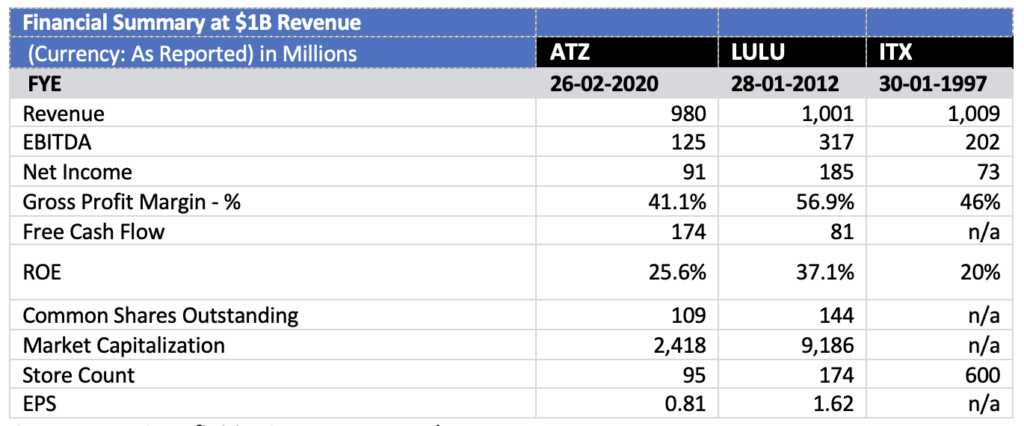
Looking at the companies’ historical performance prior to Y0, we see that Aritzia has achieved revenue milestones within a comparable timeframe as LULU and ITX, as illustrated in Figure 2 and Figure 3 below while having a financial profile similar to both. A financial summary of the companies when they reached $500M and $1B of revenue is available in the appendix.
LULU and ITX achieved the $3B revenue milestone within 3-4 years of reaching $1.8B and the $5B milestone within 6-7 years. Assuming Aritzia maintains a 5-year growth rate of 20% (comparable with LULU and ITX’s CAGR from Y0 to Y7), Aritzia will be on track to reach $3B by 2026 and $5B by 2029. If ATZ grows at our forecast 3-year CAGR of 22.9%, ATZ will reach $5B in revenue by 2028.
Figure 2: Year of Revenue, relative to Y0
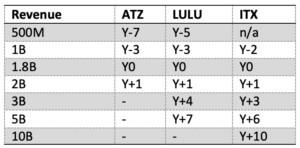
NOTE: a dash indicates company is not yet forecast to reach revenue milestone, n/a means the data is not available
Figure 3: Aritzia could generate $5B in sales in seven years.
Aritzia’s EBITDA has also been growing, as illustrated in Figure 4. We would expect Aritzia’s EBITDA growth to track its revenue growth, similar to its peers.
Figure 4: EBITDA growth over time
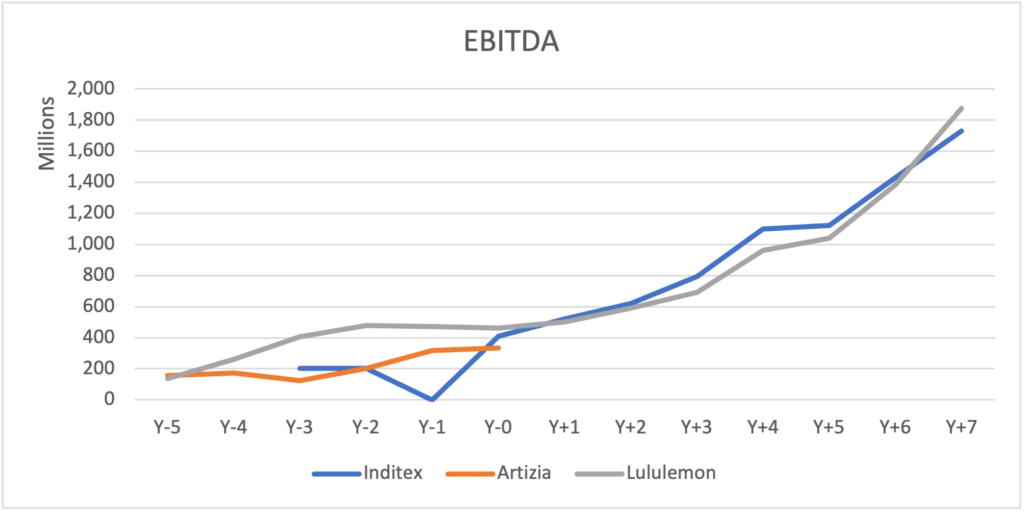
ITX and LULU were able to grow their EBITDA with limited dilution, increasing their return on equity. For the past five years, Aritzia has shown the same ability to grow its revenue while increasing its free cash flow. ATZ’s efficiency in turning its revenue into free cash flow will continue to support its ability to expand and leads us to believe that Aritzia’s next seven years will follow the same growth trajectory as that of LULU and ITX.
Turning to margins, on their journey to $5B, both ITX and LULU were able to maintain or improve their margins (differing economic conditions can distort year-to-year results). ATZ is following suit. Its net income grew at a 24% CAGR over the last 5 years, faster than its 19% CAGR in revenue. Gross and operating margins are both trending higher as ATZ is scaling and becoming more efficient thanks to its investments in infrastructure and digital capabilities. The margins for all three companies are shown in Figure 5.
Figure 5: Gross Margins Typically Expand with Scale
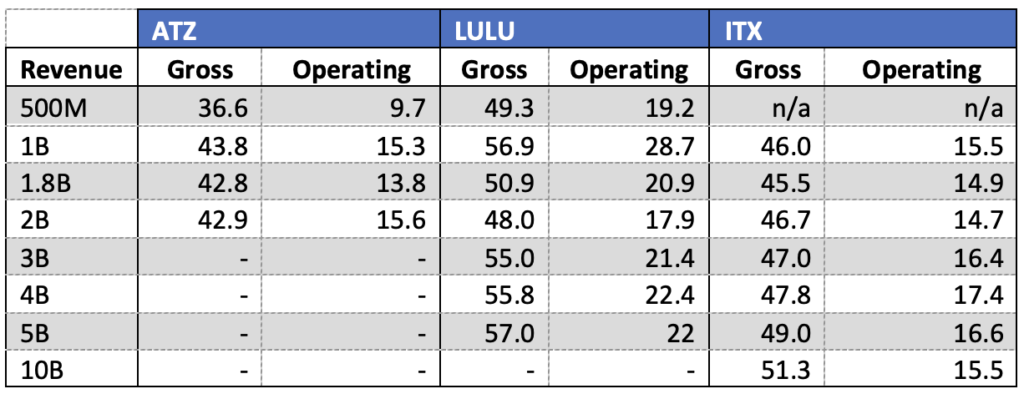
Recently, Aritzia’s gross margin has been impacted by increased SG&A costs as well as pandemic-related supply disruptions, inflationary pressure, and COVID relief subsidies. However, once supply chain issues normalize, margins should improve. ATZ’s margins are lower than LULU but are comparable to ITX, indicating ATZ should be able to grow its gross margins to the mid-to-high 40s. Aritzia’s plan is to enhance gross profit margins through sourcing efficiencies while maintaining SG&A at its current percentage of revenue.
Based on Aritzia’s most recent 3-year revenue growth rate and the experience of ITX/LULU, Aritzia should reach $3B in revenue by 2026 and $5B by 2028. Assuming that ATZ realizes more efficiencies as it scales, its operating margin should be able to expand to 16% at $3B and 17% at $5B. In addition, Aritzia has been repurchasing shares to return value to shareholders. Should it maintain its share buybacks at ~ 2% per year, we forecast earnings per share of $3.33 by 2026, and of $6.13 by 2028.
If ATZ trades at 20x – 25x P/E multiple (comparable to ITX and LULU today), this implies a share price between $67 to $83 in 2026, and $123 to $153 in 2028. Given its recent close at $46.02, we believe the stock has a potential upside of 70% over 3 years and 200% over 5 years.
In summary, Aritzia has the foundation to be as successful a retailer as Lululemon and Inditex. ATZ’s increasing profitability, free cash flow generation and strong US expansion plans all support its ability to grow and reach new revenue, earnings and share price highs.
Appendix
Financial Summary At $500M and $1B in Revenue
This Focus Stock is written by MWG Summer Analyst, Jenna Lawrence.
The purpose of this is to provide insight into our portfolio construction and how our research shapes our investment decisions. As always, we welcome any feedback or questions you may have on these monthly commentaries.

