Thoughts on the Market: September Edition
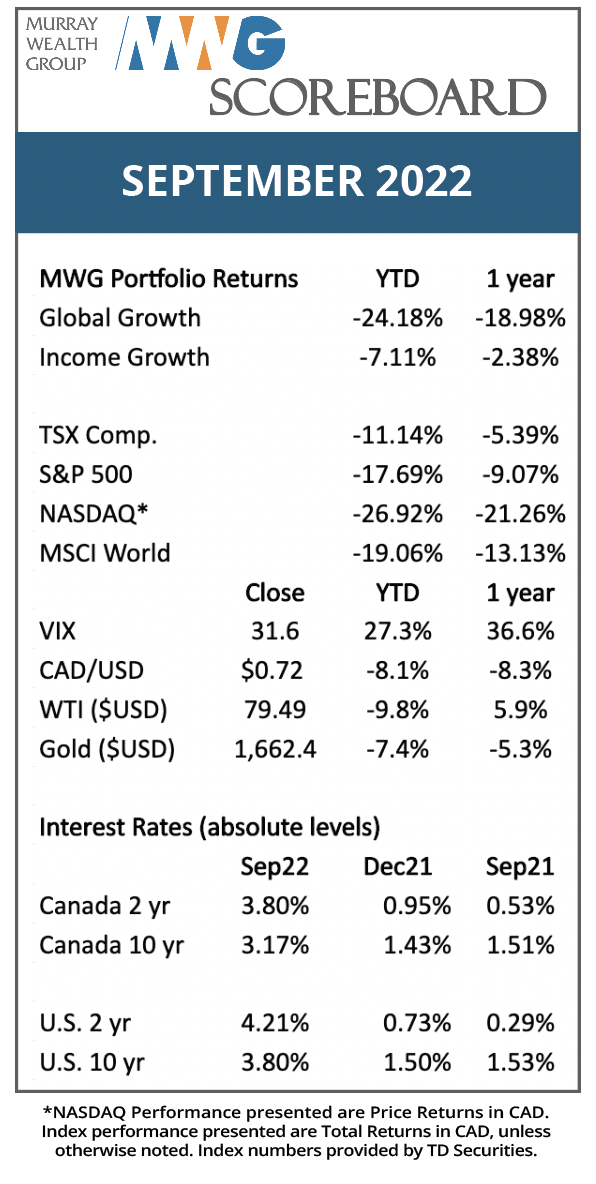
Volatility remained high through September, with the volatility index ending the month at 31, nearly double the 17 level it closed the year at in 2021. V Volatility will remain high until it isn’t, which is an obvious statement in itself, but by the time the “all clear” signal is out, the market will be meaningfully higher. We continue to monitor our portfolio companies closely and believe their financial performance remains strong.
 As financial indices deteriorated on Friday, September 23, Wharton professor Jeremy Seigel delivered a scathing criticism of Fed Chairman Powell’s monetary policy. In short, where were you a year ago and why are you here now? Asset prices, commodities, and growth are all lower. We agree with stance and believe the Fed will need to adjust, although its stubbornness may mean more volatility in the interim.
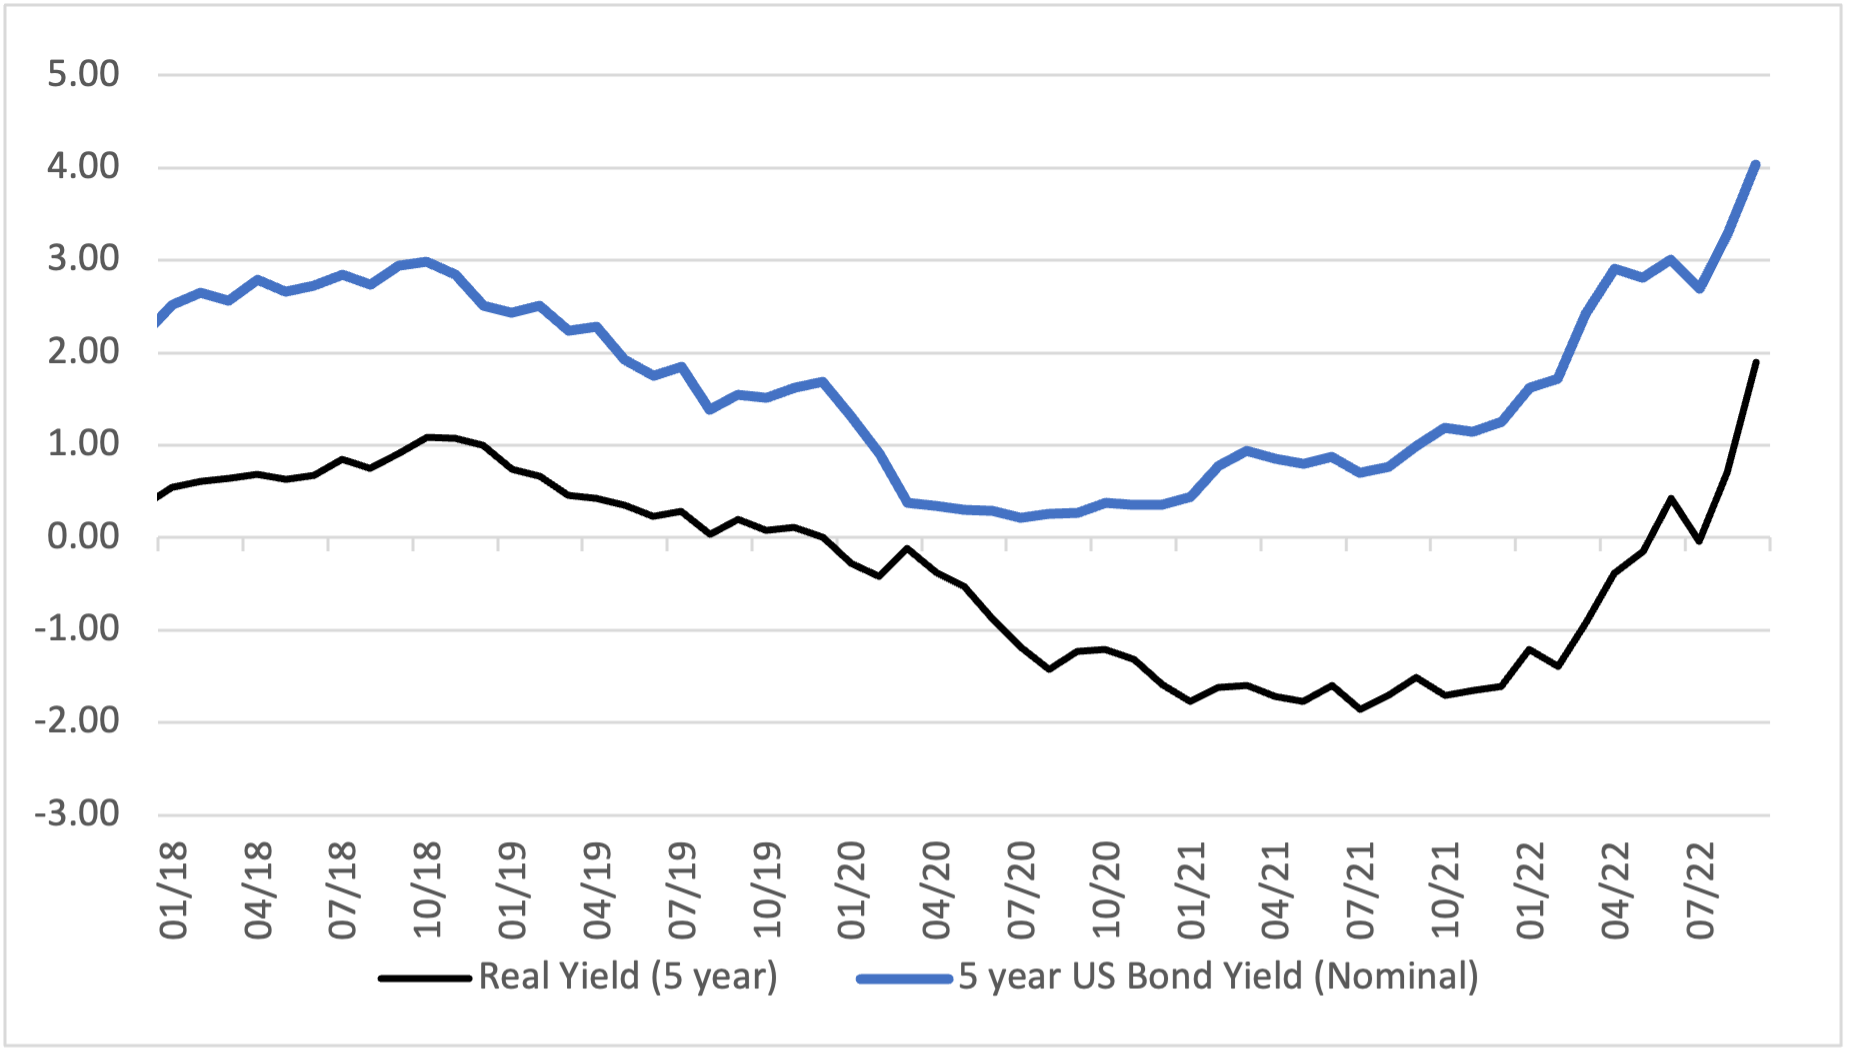
What is our rationale? Quite simply, inflation continues to ratchet down dramatically. Remember, there is a lag effect from the time interest rates rise until their full effect on the economy is felt. Consider real interest rates (real rates are interest rates after the effect of inflation, while nominal rates are the quoted rate with no adjustment for inflation). Real rates are often quoted at a certain maturity, e.g., 2-year, 5-year or 30-year. The real interest rate for the 5-year bond is illustrated in Figure 1 below. As of September 30, the real yield based on expected inflation is 1.90% (a nominal yield of 4.04% minus inflation expectations of 2.14%). At the end of 2021, the real yield was -1.61. At year-end 2019, the real yield was 0.00%. Even in 2018, real yields peaked at only 1.00%. For the first time in recent memory, bonds look attractive on a stand-alone basis. Recall, we touched on the inflation expectations concept last month.
Figure 1. Real yield of U.S. 5 Year Government Bond

Source: MWG, St. Louis Federal Reserve, Refinitiv
On October 5, OPEC announced a cut to oil quotas amounting to 2 million barrels, although with several countries already producing below quota, the effect will be closer to 1 million barrels. This comes on the heels of a 30% decline in oil prices from their June 2022 peak of US$120/bbl. The cut effectively neutralizes any further U.S. Strategic Petroleum Reserve releases and tightens the market at a time of heightened geo-political risk. While prices are expected to remain in the mid-US$80/bbl range, the futures curve remains in ‘backwardation’, with long-term crude trading at US$70/bbl in 2024. When the crude market is over-supplied, the curve is typically in ‘contango’, meaning forward purchase prices are typically higher than spot prices. Thus, it logically follows that the U.S. should continue to add barrels to a tight market to curb inflation given that they can capture the lower futures price to re-plenish the SPR down the road.
Figure 2: Crude Futures Curve

Source: Refinitiv
Why does the curve trend towards $50/bbl over time? Technology in drilling has opened new reservoirs and allowed for new development in previously uneconomic oil fields. In 2021, Rystad Energy analysis showed that breakeven prices of new developments were close to US$47/bbl. This may rise as resource development inflation sets in, but until that time, the market is signaling to producers to add more barrels to the market and benefit from the attractive economics provided by new projects today.
GLOBAL EQUITY GROWTH FUND

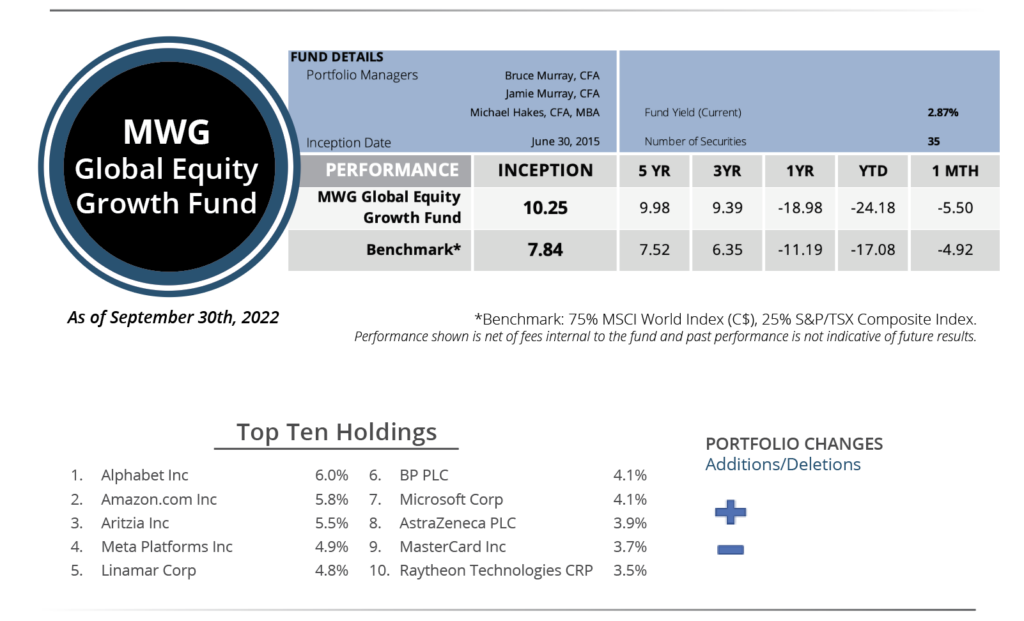
The MWG Global Equity Growth Fund fell 5.5% in September versus -4.9% for its benchmark. Year-to-date, the Fund has fallen 24% versus the benchmark return of -17%. The top three performers in the month were Converge (+15%), Ely Lilly (+13%) and Netflix (+10%), while Nike (-18%), Adyen (-15%) and Comcast (-5%) were the biggest detractors.
We made no portfolio additions or subtractions in September.
INCOME GROWTH FUND

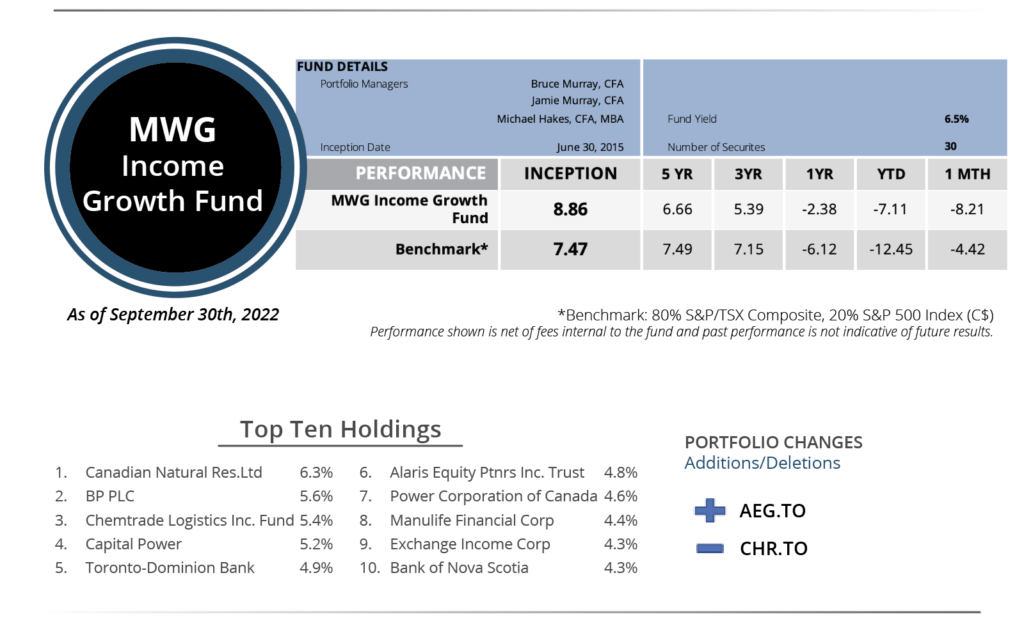
The MWG Income Growth Fund fell 8.2% in August, more than the -4.4% decline in its benchmark. The Fund is down 7.1% year-to-date versus the benchmark decline of 12.3%. Quarterhill Bonds (+3%), Cogent Communications (+3%) and Rio Tinto (+3%) led the portfolio while Corus Entertainment (-34%), American Hotel (-19%) and Chemtrade (-16%) were the top detractors.
During the month, we added Aegis Brands Convertible Debentures to the Fund. Aegis raised sufficient funds to complete a transformative purchase of St. Louis Bar and Grill, a Canadian franchisor of sports bars for $50M. St. Louis currently has 72 locations, with a strong pipeline to grow locations by 50% over the next three years. Aegis also owns a successful local coffee shop brand (Bridgehead) with locations in the Ottawa area and is successfully expanding the Bridgehead brand online and in grocers nationwide. Aegis has a strong management team that has successfully grown restaurants in the Canadian market.
To fund the purchase of Aegis, we sold our remaining position in Chorus Aviation.
This Month’s Portfolio Update is written by our Head of Research, Jamie Murray, CFA.
The purpose is to provide insight into our portfolio construction and how our research shapes our investment decisions. As always, we welcome any feedback or questions you may have on these monthly commentaries.

