Thoughts on the Market: January Edition
The world is convinced a recession is coming.
Flashback to September 30, 2022. The S&P 500 was down 25% year-to-date. European power prices had doubled in a year. U.S. inflation was running at 8.2%. The Federal Reserve and other major banks were in the middle of an interest rate hiking cycle to curb economic growth.
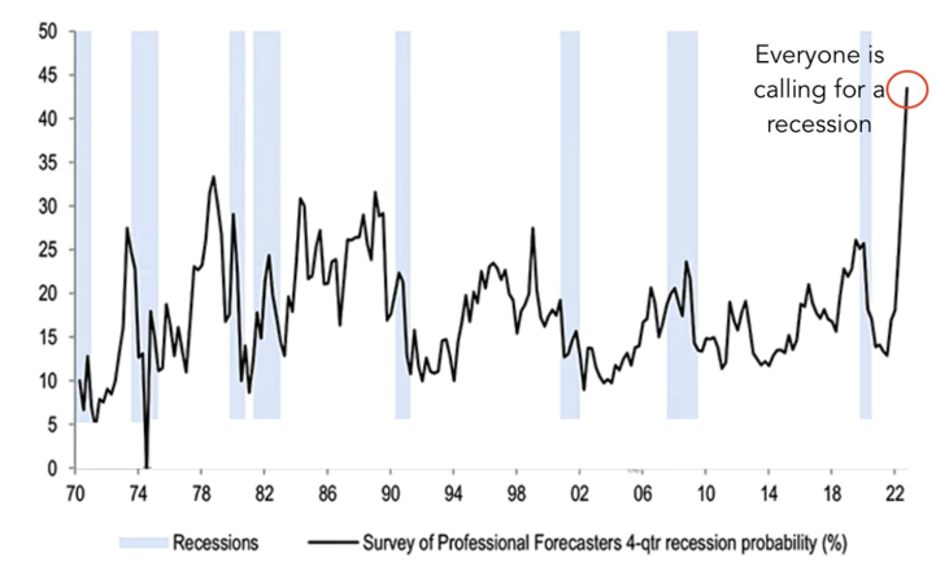
Four months later, the U.S. economy just added 500,000 jobs. Inflation is retreating from high levels and central banks are indicating that a pause in hikes is forthcoming. Yet a recent survey of economists by J.P. Morgan indicates that recession calls (defined as probability of a recession in the next 12 months) are at all-time highs (Figure 1). A secondary indicator, the AAII Bulls/Bears survey indicated 30% of investors are bullish, compared to an average level of 37%.
Figure 1. J.P. Morgan Survey of Professional Forecasters.
Source: J. P. Morgan
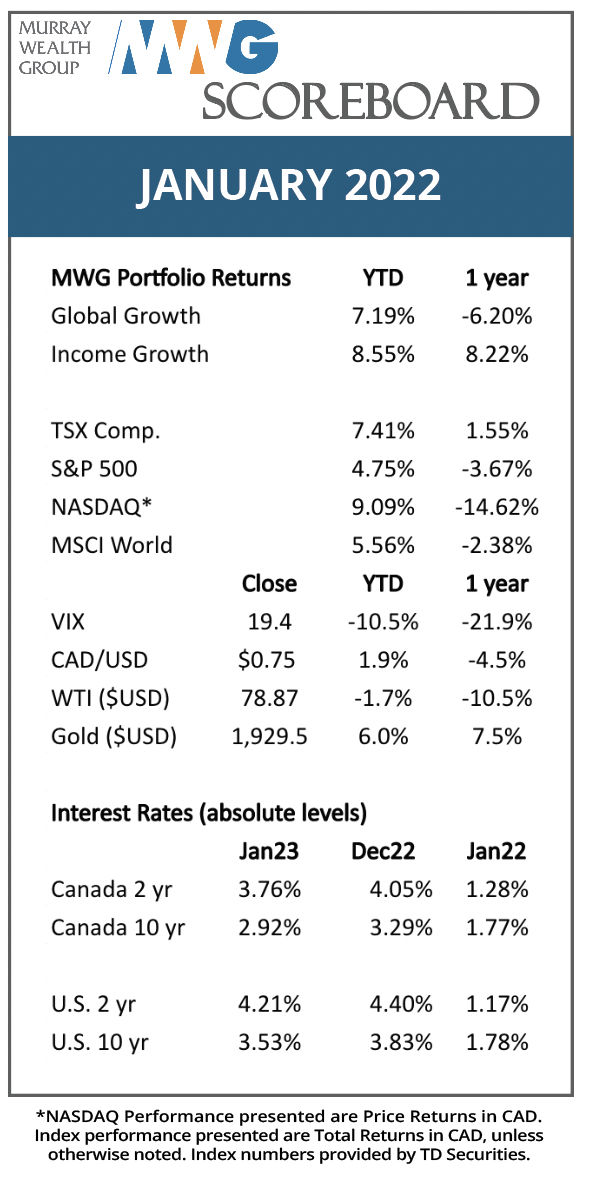
At 3.4%, the unemployment rate is the lowest it has been since the 1960s. From a labour market perspective, no recession signs are flashing. This extends into other data as recession indicators such as credit trends and consumer spending will remain resilient so long as the labour market holds up.
However, the labour market is at best a coincidental indicator. It will rise and fall with the fortunes of the economy. In the 2008-09 financial crisis, the unemployment rate bottomed in October 2009, seven months after the market bottomed in March 2009 and more than a year after the near collapse of the global financial system in September 2008.
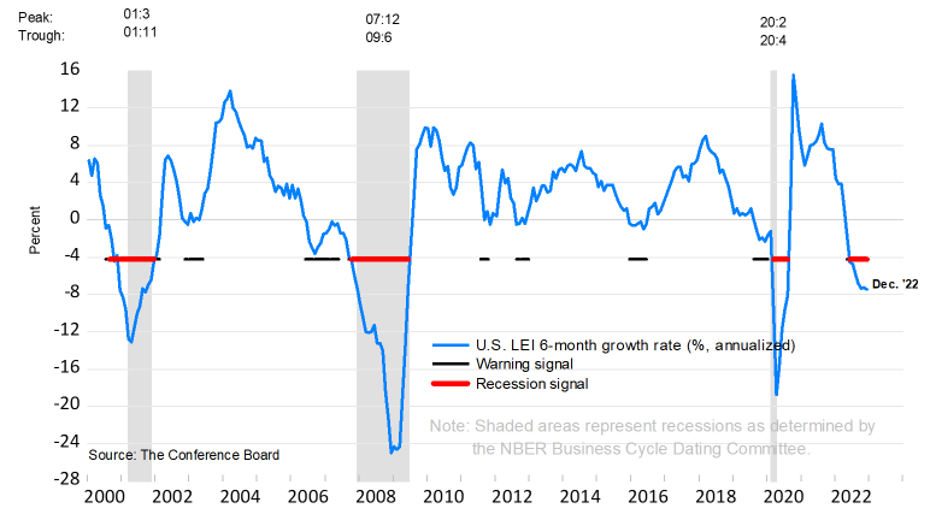
In an attempt to predict a recession, one must look to leading indicators. These are warning signs that turn negative in advance of other broad measures like GDP and employment. The Conference Board maintains a U.S. Leading Economic Indicators (LEI) Index that broadly contains the measures many forecasters look to in advance of a recession. Figure 2 presents the percentage change in the index and how it historically correlates with recessions.
Figure 2: Leading Economic Indicators Index Year-over-year change
Source: The Conference Board
After digging into its components, we believe the index represents a good sampling of indicators that are often mentioned as predictive of a recession by the investment community primarily yield curve inversion, credit performance and new orders.
Yield Curve Inversion – An inverted yield curve occurs when short-term interest rates are higher than long-term rates. It indicates that bond markets believe short-term rates are too restrictive and an economic slowdown will occur. This encourages central banks to reduce short-term rates. For example, the yield curve inverted in September 2006, a year before the market peaked in October 2007.
Credit Index – Credit performance refers to the ability of borrowers (mainly consumers and businesses) to stay current on existing loans. Credit trends have been strong over the past three years, benefitting from the record low-interest rates and high savings rates that accompanied the pandemic. However, as inflation and rising rates chip away at affordability, it is expected that consumer credit will begin to degrade. Subprime borrowers (the riskiest cohort) typically lead the cycle. Credit trends, in general, remain strong, although delinquencies in credit card and auto loans are rising (albeit from historically low levels).
New Orders – The LEI includes new orders for consumer goods (inventories) and capital equipment. When new orders for equipment are rising, it typically indicates that companies are increasing their asset bases in anticipation of further growth. The opposite holds true when new orders decline, as demand falls through the value chain. Currently, new orders for capital equipment are trending down year-over-year, indicating that the manufacturing sector is facing recessionary conditions. Whether this will spill over into the larger service-based economy is unknown.
The LEI also contains measures that can reverse quickly from month-to-month, measures such as stock prices, consumer sentiment and building permits. The full list of indicators can be found here.
In sum, the warning signs of a recession are flashing, and thus, there are high expectations of one occurring in the next 12 months. However, the stock market is not the economy, and equities do not closely track economic activity. Equity markets have typically bottomed 60-150 days prior to GDP. First quarter GDP is currently tracking around 2% (thanks to the low level of new orders), and if GDP growth troughs in the first half of 2023, it is possible that the bottom of the equity market occurred early in the fourth quarter of 2022.
Supporting this viewpoint are increased liquidity (courtesy of a declining U.S. dollar and a slowing in the pace of rate tightening), a potentially bottoming U.S. housing market and improved supply chains. As well, most commodity prices are now lower year-over-year, which should help inflation and corporate profits (save for commodity producers, of course). We need to see corporate profits ultimately improve to confirm the equity rally, but believe our portfolio holdings will weather any economic volatility. We will be covering these topics in more detail during our February 14, 2023 webinar.
GLOBAL EQUITY GROWTH FUND
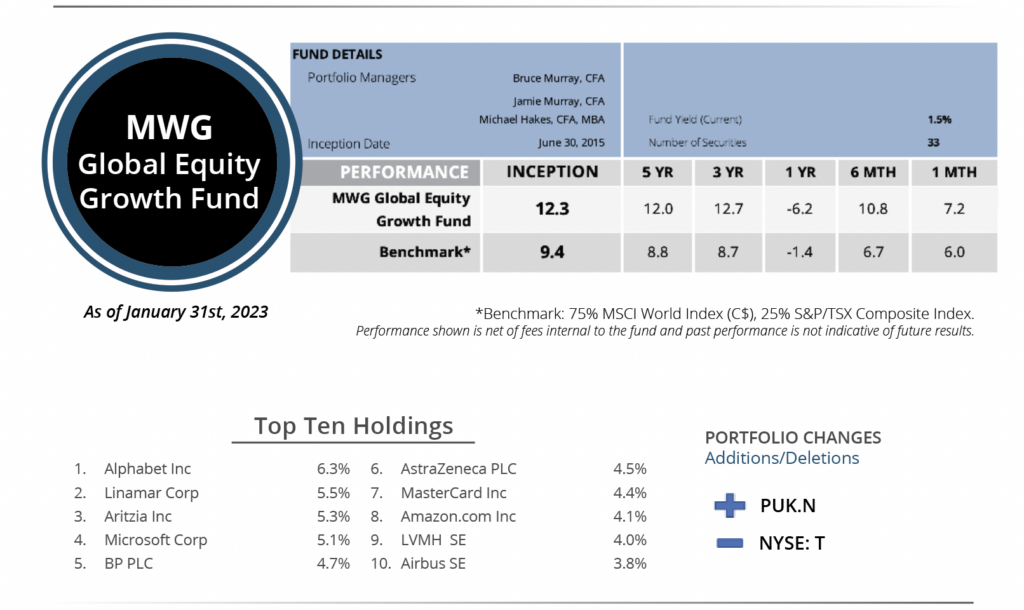
The MWG Global Equity Growth Fund increased 7.2% in January versus a 6.0% return for its benchmark. The Fund’s return remains ahead of its benchmark since inception and on a 3 and 5-year basis (please reference the table above). The top three performers during the month were Converge Technology (+25%), Uber (+23%) and Meta Platforms (+22%), while UnitedHealth (-7%), Eli Lilly (-7%) and Intuitive Surgical (-9%) were the biggest detractors.
During the month, we started a position in Prudential PLC. Prudential has transformed into a pureplay leading Asian/African life insurance manager. Insurance and markets in Asia are growing quickly, and we believe Prudential differentiates itself with a unique multi-channel distribution model with 500,000 agents and access to 30,000 bank branches. The former CEO of Manulife Asia, who has impressed us favourably, will be taking the reins of the company in March 2023. The shares are attractive at an 18x P/E multiple given the long growth runway ahead.
To fund the purchase, we sold our position in AT&T.
INCOME GROWTH FUND
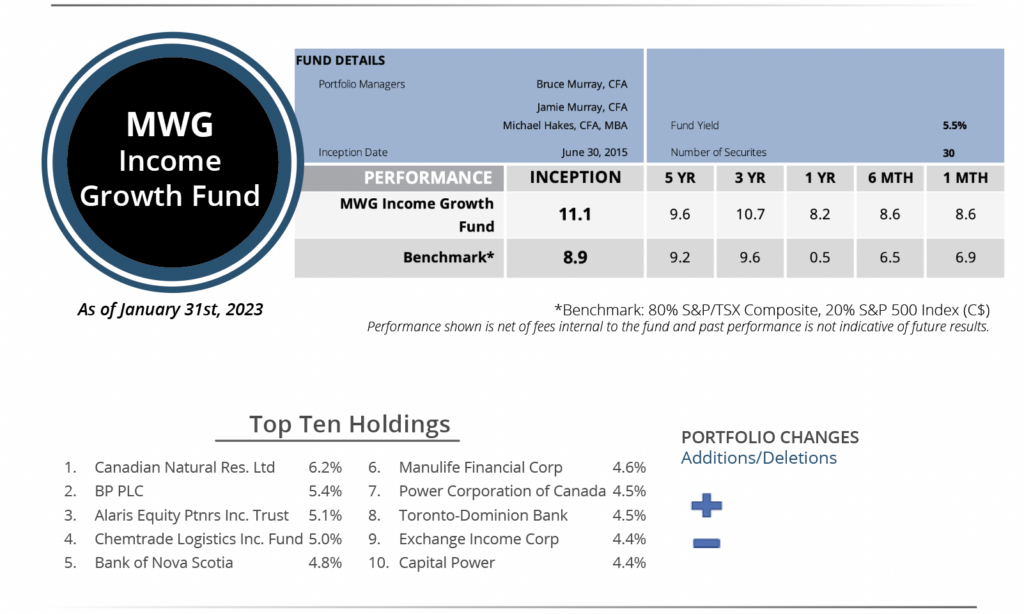
The MWG Income Growth Fund rose 8.6% in January versus a return of 6.9% for its benchmark. The Fund remains ahead of its benchmark since inception and on a 3 & 5-year basis (please reference the table above). The top three performers during the month were Doman Building Materials (+29%), Blackstone (+27%) and European Residential (+24%), while IBM (-6%), Capital Power (-3%) and Evertz (-2%) were the biggest detractors. The fund yield is 6%.
We made no changes to the Fund in December.
This Month’s Portfolio Update is written by our Head of Research, Jamie Murray, CFA.
The purpose is to provide insight into our portfolio construction and how our research shapes our investment decisions. As always, we welcome any feedback or questions you may have on these monthly commentaries.

