Monday’s large market sell-off (S&P 500 Index down 3.3%) due to Coronavirus and U.S. Political concerns will be addressed in our February Portfolio Review next week. Our phone and email lines are always open if you have questions or would like to reach us personally.
What's Happening in the Oil Market?
After its fall in 2014 from US$100+, oil prices have bounced between US$40-70/barrel (bbl) save for a few peaks and dips outside of that range. CNBC Commentator Jim Cramer called for the death of oil last week on his show Mad Money, saying these companies are un-investable due to the acceleration of climate change and an increasing focus on ESG (Environmental, Safety and Governance) changing investment trends. Recently, Blackrock committed to doubling its ESG friendly ETF offering and shunning companies that derive more than 25% of revenue from coal.
Oil and commodities are inherently cyclical. And while it’s true that oil is being replaced by other forms of cleaner energy, this trend has been ongoing for several decades. In 1990, oil consumption represented half of global energy consumption. Today, with millions of more cars on the road, global oil consumption is about 40% higher than it was in 1990, but down dramatically as a percent of total energy consumption to 34%.
Figure 1: Shares of Global Primary Energy Consumption by Fuel
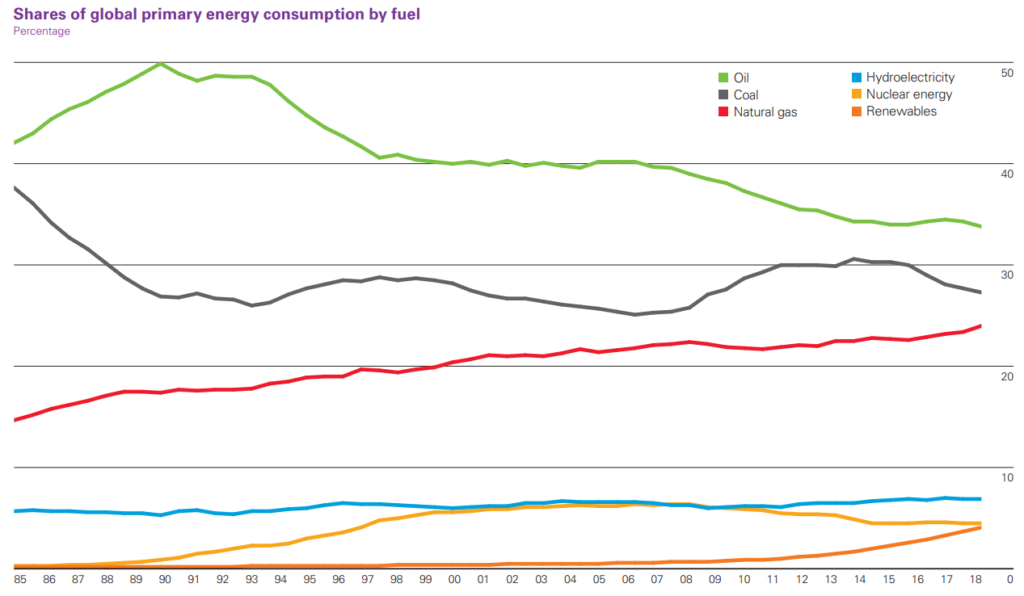
As noted above, while oil’s market share is declining, its absolute consumption is not. In 2018, consumption reached 100 million barrels of oil per day, a 1.5% increase year over year and an acceleration from the 1.0% average growth rate from 2007-2017.
To understand oil prices, we must look to the supply side and marginal cost. As can be seen in Figure 2, U.S. supply grew quickly from 2005-2015 before falling in 2016 as drilling activity fell, following but lagging the 2014 oil price correction. When oil prices rose, U.S. production responded quickly, with the U.S. adding a record 2.2 million bpd in 2018 (the largest increase in a year for a single country).
Figure 2: Global Oil Production Growth
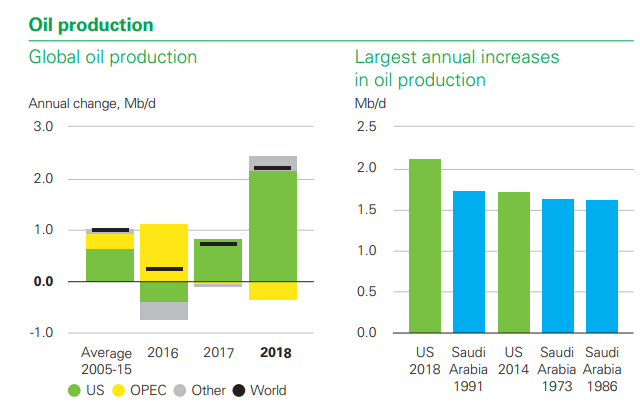
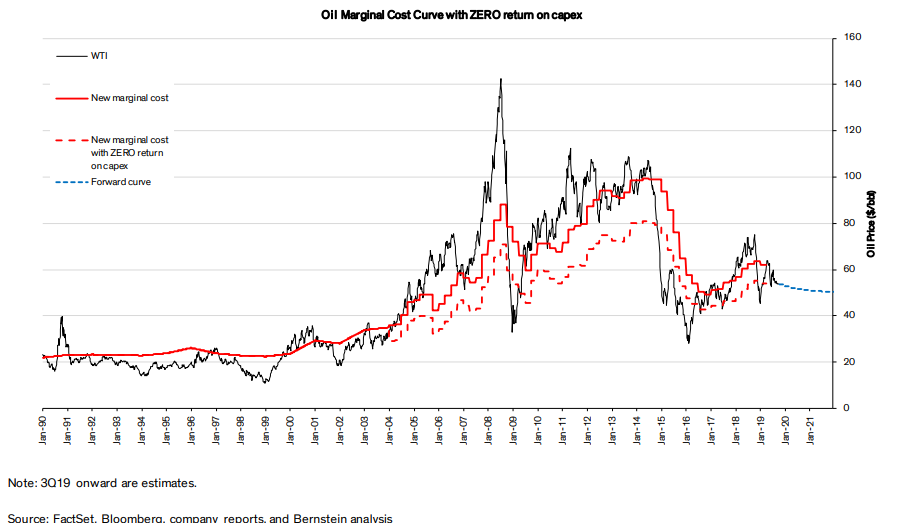
It is widely accepted that North American oil, particularly U.S. shale, is currently the marginal barrel of oil produced. According to Bernstein Research, the current marginal cost of oil is about US$60, slightly above current prices. Below marginal cost, producers are not incentivized to grow oil production. Assuming there is insufficient supply capacity below the marginal cost (i.e. some new large oil discovery that can be produced more efficiently than U.S. shale), we should see prices appreciate from here to spur drilling that will be required to meet growth in demand.
Figure 3: Marginal Cost of Oil VS Oil Price
Valuation.
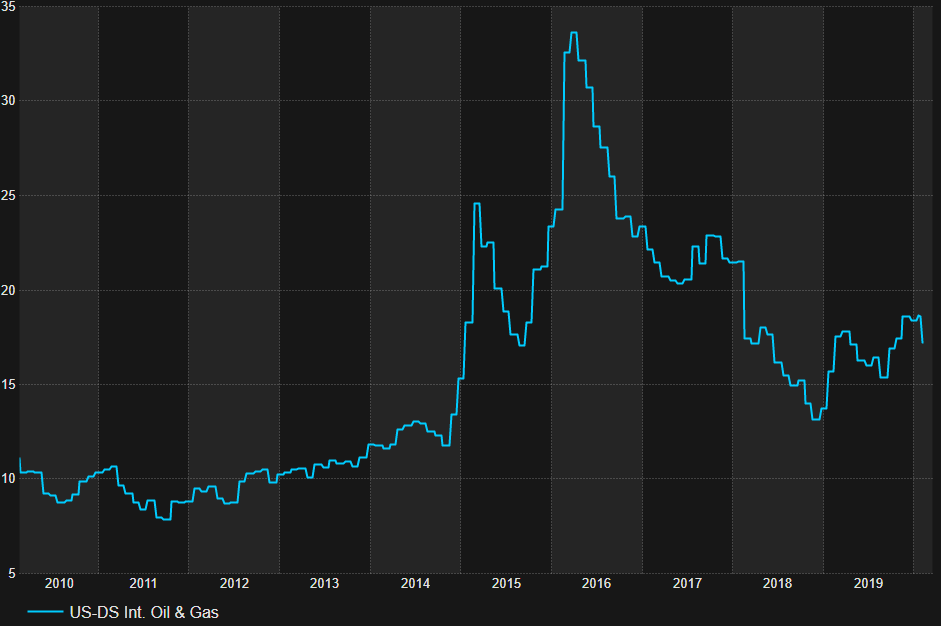
Two common valuation metrics for oil companies are the ratio of price to earnings or cash flow and a more technical discounted cash flow based on the company’s reserves and a forward price assumption (Net Asset Value or “NAV”). Both are commonplace but investors currently seem focused on near-term earnings/cash flow metrics. As shown below, the U.S. peer group is trading at a P/E multiple of approximately 17.5 times. This is actually a premium to multiples experienced earlier this decade (cash flow metrics showed a similar relationship), although we note that multiples tend to fall when oil prices significantly exceed the marginal cost, and valuations across equities are much higher today than they were in 2010-2013.
Figure 4: Composite P/E Ratio for U.S. Oil Exploration & Production Companies
On a NAV basis, valuations are much less demanding as the market has started to place discounts on corporate reserve values. We’ll use a former market darling in Canada, Whitecap Energy, as an example. In Feb 2019, the company reported the following NAV values. At the time, its share price was $4.29.
Figure 5: Price/NAV for Whitecap
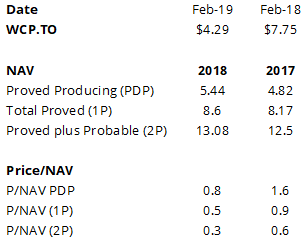
*NAV’s estimate the future value of a company’s reserves and are subject to geological estimations and future commodity prices. Reserves are categorized as follows: Proved reserves have a 90% chance of recovery. PDP – from producing wells, 1P – includes undeveloped reserves (i.e. future drilling), 2P – 50% chance of recovery.
Historically, Canadian oil companies have traded in line or at a premium to NAV based on proved and probable reserves (2P NAV as shown in the table above). For example, in 2014, Whitecap’s average share price was about $14.20 compared to a 2P NAV of $13.33. In 2015, following the oil price correction, investors started to place discounts on reserve values, essentially indicating they would not assign value to future production and cash flow, and thus oil stocks started trading more on the basis of proved producing reserves (PDP). At a P/NAV of 0.8x based on PDP, investors were indicating that the cash flow value of Whitecap’s currently producing wells (i.e., if the company did not drill another well ever) should be discounted at a rate higher than the standard 10% used by industry engineers.
Putting It All Together.
Tesla Inc. shares have tripled since the summer of 2019, indicating that the market is looking at a major shift in consumer behaviour with accelerated electric vehicle adoption in the near term. However, despite the excitement around electric vehicles, oil demand continues to increase. Oil cycles are shortening with advances in shale drilling, which enables a faster supply response.
We believe there’s a chance for an uptick in the oil market short term as the rate of decline in global base production is increasing as a result of constrained capital spending on the part of producers. However, higher oil prices (and gasoline prices) will serve to accelerate any shift to electric vehicles as economics shift to EVs. With more investors shying away from hydrocarbons due to ESG and other increasing anti-oil social pressures, it is difficult to see a re-rating of oil equities unless we see a change in sentiment.

