What are indicators saying?
Recessions are almost impossible to predict. Consider these three headlines:
“US could go into recession this year: Expert”
“There’s more than 60% chance of a global recession within the next 18 months, economist says”
“The bond market’s recession signal may be wrong this time”
The year from each respective headline – In order: April 2015, April 2017 and July 2018.
It’s not that the prognosticators did not properly analyze their data sets but that there are a massive number of variables that need to align for a recession to occur. Currently, it can be argued that certain sectors of the economy are in a recession (semi-conductors, autos, agriculture, oil, traditional newspapers). However, housing remains solid, the banking sector remains well capitalized and, most importantly, consumers keep spending.
That’s why at MWG our focus is on investing in high-quality companies that will grow at above-average rates and are able to weather a recession (some companies can even emerge stronger from recessions if they are able to take market share from weaker competitors). Take Alphabet (Google). Its advertising growth rate may slow as the total advertising market shrinks…but traditional ad markets like TV may decline more quickly as cord-cutting accelerates and consumers move to streaming options like YouTube. Thus, it will still be able to generate billions of dollars of free cash flow to add to the US$121 billion currently on its balance sheet. When the economy inevitably recovers, Alphabet’s market share may be higher than it would have been in a non-recession scenario.
With that said, let’s take a look at some leading indicators.
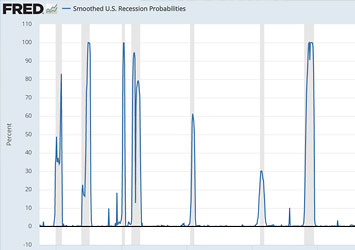
St Louis Fed Smoothed Recession Indicator
The St. Louis Federal Reserve maintains a model using four co-incident variables: non-farm payroll employment, the index of industrial production, real personal income excluding transfer payments, and real manufacturing and trade sales. The model updated for July 2019 indicates the probability of recession at 1.37%, well within a range of 0.00 – 3.28% over the past decade. While this is the highest rate since 2013, it is low enough to not trigger concern. (In recessions, probabilities will quickly climb to 60-100% .)
Figure 1. St Louis Fed Smoothed Recession Indicator

Source: Federal Reserve Bank of St. Louis
The Indicator is a good bellwether for recessionary conditions as there are very few false indicators. However, it is less valuable as a timing tool for when to increase or decrease beta given volatility usually increases in a recession.
Executive Confidence Indicators
Executive Confidence Indicators are considered important drivers of future economic activity for one reason. When executives are confident about future business conditions, they are more likely to invest capital, hire employees and grow their businesses. Certainly, there are managers that can probably prognosticate on the economic future better than others, but when it comes to forecasting, as a group, executives are likely no more accurate than economists.
We look at two of these confidence indicators below:
The Conference Board CEO Confidence Survey. The Conference Board conducts a quarterly survey of U.S. CEO confidence. The latest results indicate continued pessimism, with a reading of 43, unchanged from the previous quarter (a reading over 50 indicates optimism). CEO’s remain pessimistic about economic growth and profit expectations. Only 13% indicated that current conditions are better than they were six months prior.
Figure 2. The Conference Board CEO Confidence Indicator

Source: The Conference Board
Duke CFO Confidence. Duke University’s Fuqua School of Business conducts a similar survey of Chief Financial Officers. Similarly, CFO confidence has been declining compared to last year, with many believing a recession will occur in 2020. Interestingly, difficulty attracting and retaining qualified talent was the top concern of CFOs, a worry that is normally associated with strong job markets and wage growth (expansionary conditions). Recession concerns are still high, although they have declined from six months ago. Despite recession worries, confidence remains in normal ranges for periods of economic expansion.
Figure 3: Duke CFO Confidence Survey

Source: Duke University
The Inverted Yield Curve
Typically, the yield curve (a plot of interest rates over various terms) slopes up to the right. It is more expensive to borrow money over a longer term (which is known as the term premium). However, there are instances where short term rates (driven by Federal Reserve monetary policy) trade higher than long term rates. Historically, this is viewed as a recession indicator as the bond market signals that lower rates are necessary to spur growth. Typically, this has occurred within 6-24 months of a future recession. But this time the yield curve inversion is likely a condition of several new phenomenons following the credit crisis of a decade ago, rather than a signal that “bad credit” is going to bring down the economy. So naturally, we should be prepared to be more cautious in the interim. However, at the risk of saying the famous last words, “this time is different,” we see reasons to be skeptical of the yield curve inversion.
Figure 4. Yield Curve Inversion has historically occurred before a recession

Source: Federal Reserve Bank of St. Louis
Quantitative Easing – Central banks globally have been buying long-terms bonds to push down interest rates. Although this activity slowed in 2017-18 (coinciding with a sharp move higher in yields), many banks are planning to restart QE programs.
Convexity Hedging – This is a complicated topic that Bloomberg does a good job explaining in this article. Financial firms hedge interest rate risk in certain of their products such as mortgages and insurance. They do so by trading long term bonds to offset the shorter-term duration of their operations (a five-year fixed mortgage for example). With lower interest rate, much larger amounts of hedging are required and thus this activity starts to play a larger role in the market. This can lead to dislocations in the yield curve and reduce its predictive power versus of historical instances.
Technology Deflation – We are strong proponents of the theory that technology will continue to enhance productivity and improve standards of living but have a deflationary effect on prices and cause structural unemployment (in certain industries). If true, as technology spending continues to infiltrate the economy, these deflationary forces will limit inflation and cause interest rates to remain low.
Conclusion
Yield curve inversion aside, these indicators can reasonably be used to determine if recessionary conditions are present, with deteriorating trends indicating the onset of a recession. However, as volatility tends to increase in a recession and equities make large and fast moves both to the upside and the downside, there is risk in trying to time a move in or out of the market. Yield curve inversions present an ominous sign that cannot be ignored, but there are reasons to believe it may not be as prescient as it has in the past.
With positioning and bearishness rampant through the summer, we believe there is a strong possibility for a rally in the equity market to new highs into winter. However, being aware that many outcomes are possible, we continue to focus on investing in well-run companies with strong growth profiles and excellent balance sheets.
This piece is written by our Head of Research, Jamie Murray.