Thoughts on the Market: April Edition
Markets fell sharply in April. There’s a lot to cover… Read on!
Written by Jamie Murray, CFA
We wrote in the past about the 2000 technology bubble and the similarities and differences between today’s companies and the tech giants of 2000. To summarize, many companies caught in the 2000 bubble, such as Cisco (or Nortel) and Oracle, were reliant on high value one-time sales. These firms sold an abundance of technology products or software into the Y2K/fibre networking/ internet revolution, only to see demand exhaust itself and product sales decline. Both Cisco and Oracle’s sales were 16% lower in 2003 than they had been in 2001. Even Yahoo, whose model focused on advertising more akin to Alphabet or Facebook, experienced a fall in revenue of 44% in 2001. Yahoo had traded at a $120 billion dollar valuation near its peak (120x revenue). For comparison purposes, Cisco and Oracle traded around 22x and 17x revenue. Today, those numbers are 4x and 6x, respectively.
Shortly after we wrote about this in August of 2020, swaths of SPACs, meme stocks and IPOs benefitted from loose liquidity conditions, and investor demand for speculative companies sent technology shares soaring through February 2021 (Figure 1). Extreme demand from both retail investors and Silicon Valley venture capitalists drove valuations in highly speculative companies to extreme levels. If there was a bubble, it has clearly burst as indicated by the share price performance of Robinhood, Virgin Galactic or Lemonade Insurance, three former highflyers, that are all down at least 80% from last year’s peak.
Figure 1. IPOX SPAC Index Aug 2020-May 2022
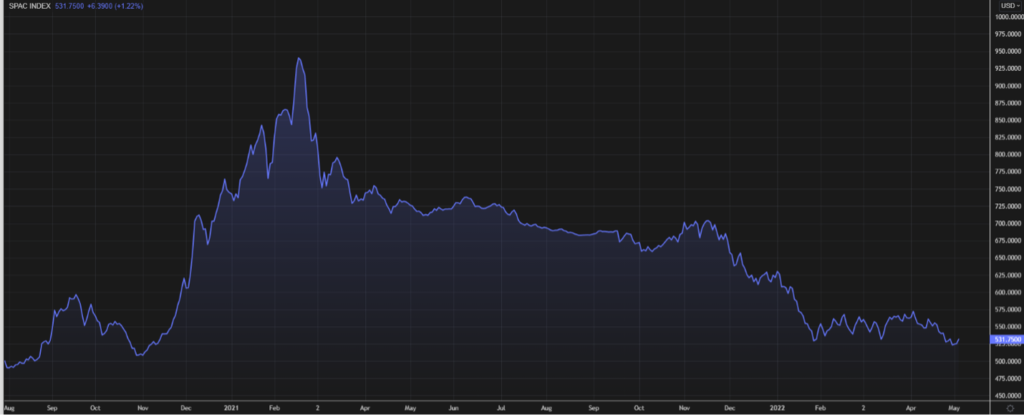
Source: IPOX SPAC
To be clear, there are still signs of speculation, with investors betting heavily on the future growth and market development in sectors such as electric vehicles. Electric vehicle makers Rivian, Nikola and Lucid Motors, which have minimal revenue, trade at a combined market cap of US$50B. Clearly, if these companies are unable to develop marketable products that generate cash flow, there will be further losses. Even companies like Tesla and Nvidia, which have superior product, present higher risk, in our view, if pricing, costs and market share do not develop as the market anticipates. What, then, explains the underperformance of global growth names such as Amazon, Meta, Alphabet and Microsoft, which we do not consider to be speculative stock? Essentially, they are being affected by the same factors that are causing poor performance in many non-technology names: a COVID hangover following a pull forward in demand, supply chain challenges, inflation and rising interest rates. Other stocks down 25%+ year-to-date are Domino’s Pizza, Toll Brothers, JP Morgan, Boeing, Pool Corp and CarMax, just to name a few. The swift move in interest rates and ongoing supply chain challenges have created a perfect storm for these companies as they struggle to balance supply and demand.
These short-term dislocations should eventually resolve themselves with the normal ebbs and flows of the business cycle. Company commentaries are indicating that spending plans are already slowing. Amazon, which doubled its 800,000 employee base over the pandemic, now has excess fulfillment capacity and plans to ease new hiring. Facebook is slowing its spending plans. Netflix and Wells Fargo are laying off employees. As investment returns fall and valuations contract, access to capital will be more scarce. This will set the table for returns on capital to start improving again.
Pressure on the Federal Reserve to reduce inflation will continue until we see headline inflation fall. The market is now anticipating an aggressive stance on the part of the Fed, with upwards of 8 hikes priced into the futures curve following the 50 basis point increase on May 4th. Quantitative tightening will begin in June. We remain hesitant to join in the chorus of recession calls, given that we believe supply constraints are behind the depressed level of economic activity. Improvement in supply chains could lead to a goldilocks market in which production increases and pricing ease.
GLOBAL EQUITY GROWTH FUND
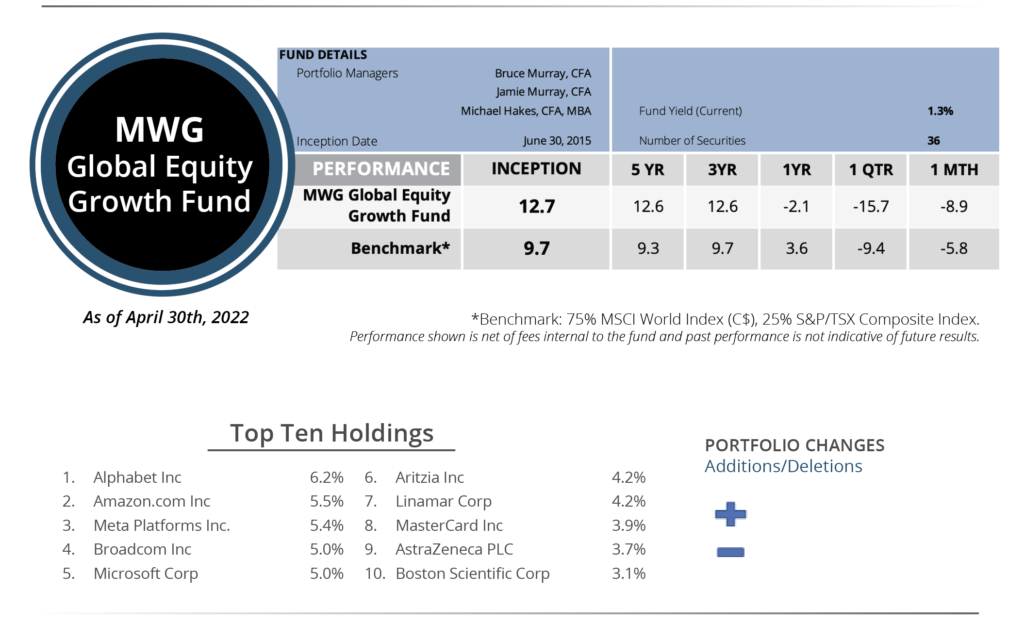
The MWG Global Equity Growth Fund fell 8.9% in April, more than its benchmark of -5.8%, as the Fund’s weighting towards communications, technology, industrial and consumer discretionary stocks was disproportionately impacted by rising interest rates and recession fears. Year-to-date, the Fund has fallen 15.7%.
We made no changes to the portfolio during the month. We continue to monitor the growth prospects, margins and liquidity of our portfolio companies. While headwinds are present in the form of inflation and the removal of liquidity by the Federal Reserve, we believe that the long-term growth prospects of our holdings will endure as markets move through normal cycles. We note that the long-term performance of the Fund remains strong (up 12.7 % per annum since inception) both in absolute terms and in relation to our benchmark (up 9.7% per annum on the same basis), and we strive to deliver similar returns going forward.
INCOME GROWTH FUND
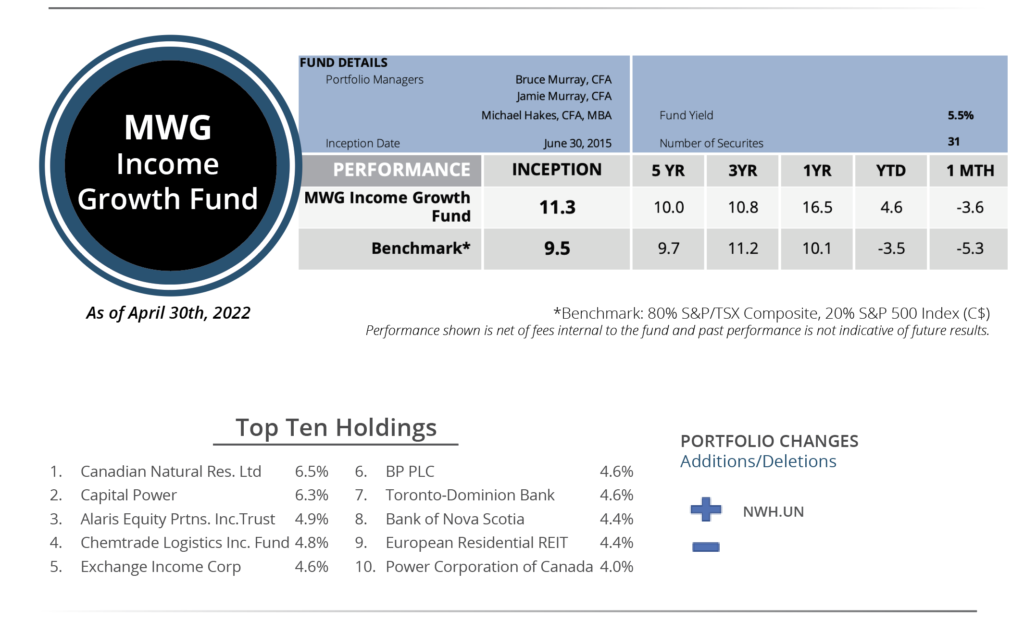
The MWG Income Growth Fund fell 3.6% in April, besting its benchmark of -5.3%. The Income Fund has now returned 4.6% year-to-date.
During the month, we added a position in Northwest Healthcare REIT (NWH.UN), an owner and manager of hospitals and medical office buildings with operations in Canada, the U.S., Australia and the United Kingdom. The company is shifting to an asset management model, whereby NWH will manage real estate under a joint venture model. This leverages NWH’s relationships and scale to create a high margin revenue stream across a larger asset base, as NWH will provide about 30% of the capital, with the remaining 70% coming from its partners. The REIT currently yields 5.7%, and given the high replacement cost of its assets, should provide good long-term value.