|
|
Aritzia has been a core holding in our Global Equity Growth portfolio for the past 18 months, having increased our position to a 4% target weighting from 2% during the depths of the pandemic. The position has performed particularly well in the past year with the shares up 125%. We have always been fans of Aritzia, first adding the name in the fourth quarter of 2018, and summarized our investment thesis in May 2019, when we highlighted the benefits of Aritzia’s direct-to-consumer (DTC) approach and its U.S. expansion opportunity.
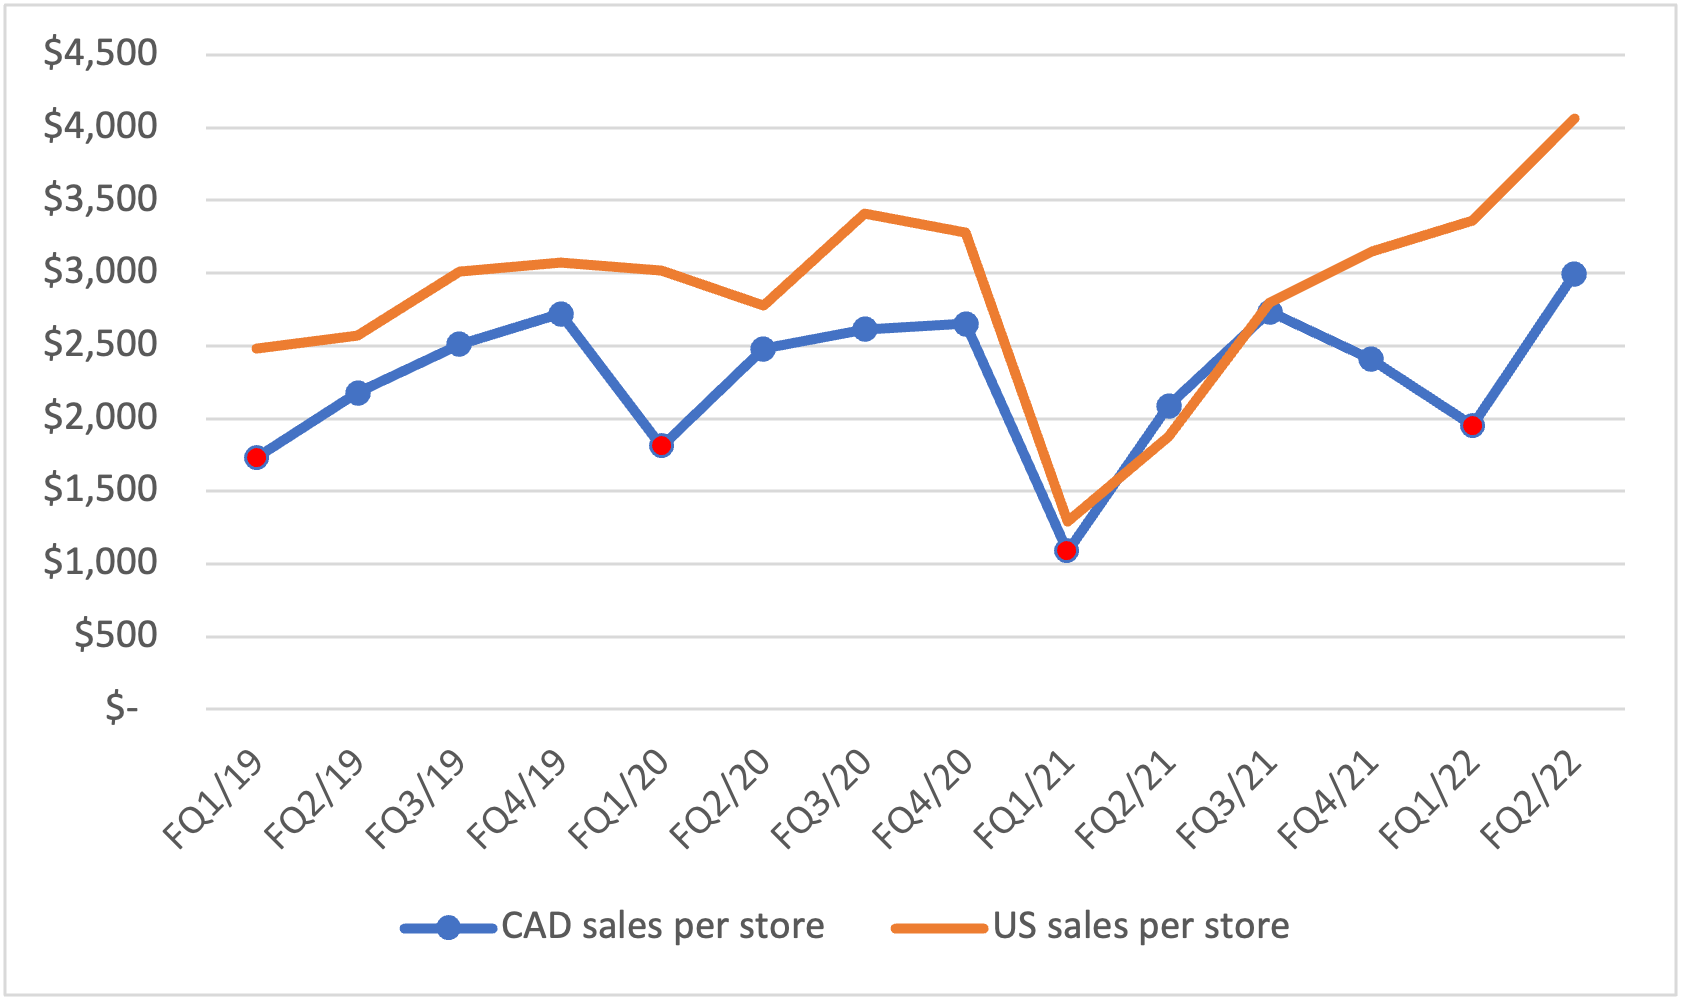
Two years and a pandemic later, Aritzia’s U.S. expansion strategy is playing out stronger than expected. First off, the pandemic has accelerated the adoption of eCommerce, with Aritzia’s DTC operations benefitting from this shift. Secondly, its brand strength, balance sheet and the fact that it is “under-stored” allows the company to stay on offence while other large mall retailers are on the ropes. This combination of factors helped Aritzia grow first half FY22 U.S. revenue 73% from the same period two years ago. eCommerce revenue increased 169% over that timeframe.We can evaluate Aritzia’s brand strength using Google Trends. Google Trends benchmarks weekly search activity to the highest level in a selected period. Figure 1 shows the 3-year trend for U.S. Google searches. The two spikes in the middle represent Black Friday searches in 2019 and 2020, indicating peak search interest in Aritzia. Interestingly, recent U.S. search activity has trended towards levels close to Black Friday even though Aritzia has not had any promotional activity in 2021. We believe this indicates increased interest in the brand and expect searches on 2021 Black Friday to achieve record levels.
Figure 1. Aritzia United States Search Trends (Oct 2018-Oct 2021) |

Management also contends that in addition to strong store-level economics from all its locations, local eCommerce sales also benefit, increasing 100-200% from the opening of a physical store in a new market. Using Google Trends again, we can view state-level interest and corroborate this with management’s claims.* The map below (Figure 2) works as a heat map, with darker blue states indicating a higher proportion of search activity. For the more data-focused reader, we also present the top 10 states and the states ranked 31-40 as many of the states at the very bottom, such as 50th ranked Montana (pop. 1M), are insignificant from a market perspective.
Note that the top 10 districts are all states where Aritzia has solid store coverage (relative to population). For example, Aritzia has nine locations in California, with stores in the Los Angeles/OC, San Francisco and San Diego Metro area/suburbs. In contrast, Aritzia has no stores in Florida (yet… a Miami store is coming soon) but has a relative search interest of about 1/6 of California.
Figure 2. Aritzia United States Search Trends by State


|
|

Expanding the Total Addressable Market
If we assume U.S. stores are more productive due to less saturation and the benefit of higher eCommerce penetration, then Aritzia could open 150 locations in the United States with high economics to achieve a $2B sales run rate (assume $14M sales per U.S. location versus $11M in Canada). Assuming an increased pace of store openings of 10-12 locations per year, would yield a 10-year inventory of new locations.
Looking at historical results helps frame the Aritzia opportunity today, but highlighted below are three other long-term opportunities for Aritzia:
- SKU Expansion – Aritzia believes it can double its SKU count over five years thanks to the unlimited nature of shelf space available online. While many SKUs will be a simple expansion of colours or sizes of existing designs, the company sees the opportunity to expand into new product categories such as intimates and swimwear.
- Men’s – Aritzia is expanding into menswear with its SuperPuff jacket and through the acquisition of Reigning Champ. While progress will take place incrementally, Aritzia can selectively grow this segment over time.
- International – We believe Aritzia could look to Europe as its next growth leg once it fully develops its premier locations in the United States. A store network in London, Paris, Milan, Munich, and Barcelona would significantly grow Aritzia’s European presence, allowing it to leverage eCommerce primarily to service the continent.
Valuing Aritzia
We believe Aritzia shares should continue to increase in value. Earnings per share could reach $2.00 per share by FY24/25. If we include the cumulative $4.00 of free cash flow per share generated in the interim, applying a 30x multiple to earnings, would yield a $64 target price in 2 years’ time. Discount that back at 8% and a current price in the mid-50s is a “back of the envelope” fair value. This target price assumes upwards of 55 locations in the United States.
This would give Aritzia a market cap of ~$6B. However, it is a brute force exercise to apply a target multiple to a predicted earnings estimate. It is difficult to capture the true growth potential and risk of a company, even more so when Aritzia has grown at a high return on equity and should start to see further benefits of scale. When compared to the $50B market cap of Lululemon, however, it’s easy to envision more upside. In summary, the thesis we outlined two years ago seems to be playing out and there remains a lot more opportunity ahead.
This Focus Stock is written by our Head of Research, Jamie Murray.
The purpose of this is to provide insight into our portfolio construction and how our research shapes our investment decisions. As always, we welcome any feedback or questions you may have on these monthly commentaries.