Thoughts on the Market: September Edition
Written by Head of Research, Jamie Murray, CFA
Bond Math
September continues to be a brutal month for equities as markets fell globally despite data that indicates strong GDP growth in the U.S. Workforce participation rates are normalizing leading to continued gains in employment but also loosening the labour market. This is leading to a slowing of wage growth. This combined with larger output volumes should slow inflationary pricing pressures but also lead to better profit margins. There is still a classic inventory correction recession in our near future once output catches up to the excess demand created during the pandemic shutdown, we would expect this to be the catalyst for the global central banks to neutralize anti-inflation policies. We believe the stock markets of the world will rally on this looking forward to a stabilized productivity driven economy with the opportunity of strong profit growth. In the short term, interest rates will continue to dominate the market narrative.
Interest rates hit a multi-year high as we exited September, with 30-year yields in the U.S. and Canada touching 4.75% and 3.8%, respectively. As bond yields move higher, bond prices decline. It’s important to understand the distinction between bond “investing” and bond “trading”. Consider this example. A bond investor (Investor A) buys a 3% coupon ($30 payment) 30-year Government bond at Par ($1,000) on Day 1. If this investor holds this bond for 30 years, the return will be 3% per annum despite any changes in interest rates in the interim. However, the price of that bond will fluctuate throughout the period. Now imagine that 30-year rates rise to 4% from 3% on Day 2. Now a new investor (Investor B) looking to purchase a bond will demand a 4% rate on a bond purchase, and thus, the same bond that was sold at Par on Day 1 will trade closer to $827 on Day 2. Some quick bond math on how we calculate this: a $30 coupon payment on a $827 bond price equals a yield of 3.62%. The extra 0.38% annual return comes from the capital appreciation of the bond, as the investor will still get $1,000 principal back 30 years later, essentially earning the $173 discount over that period. This 4% return is referred to as the bond’s yield-to-maturity.
This scenario highlights the distinction between long-term investing and trading. If Investor A were a bond trader, they would be commiserating a negative 17.3% return on Day 2. However, investor A understood when they purchased the bond that 3% was what it would return, no more and no less, and thus, there was no need to pay attention to weekly gyrations in markets. The adjustment in price on any given day would reflect a difference in market return expectations, not the quality of the investment.
The above bond math is also true for equities. As bond yields rise, equity investors also demand a higher return and prices fall to reflect this temporary adjustment. This is particularly evident in dividend yielding stocks, with many yields now approaching 7-8% versus 5-6% levels in 2022. Despite the short-term pain, we now expect forward returns for these interest sensitive sectors like REITS and Utilities to be higher for investors putting new money into the market currently.
As outlined, we are of the view that interest rates need not increase further given the Federal Reserve’s dual mandate of low inflation and full employment, although this has not proven to be the right call thus far. Our view stems from a normalized supply chain, a slowing consumer economy and falling commodity prices that have created a disinflationary economy. We believe a “higher-for-longer” message from the Federal Reserve is the main reason for the increase in yields.
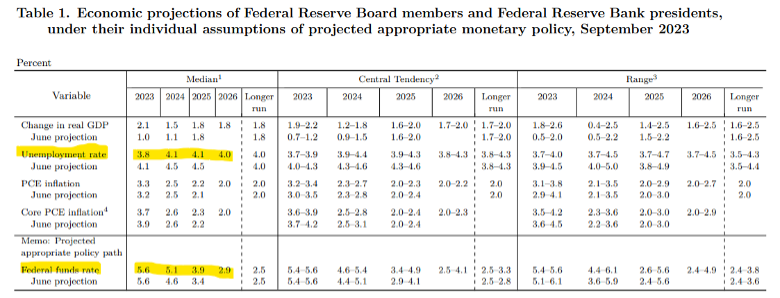
Figure 1 provides economic projections for salient economic data points by Federal Reserve Board (FRB) members. The key to September’s FRB meeting (highlighted in yellow) lies in the stronger employment forecast through 2025, and hence, a need for higher rates as FRB members believe inflation cannot be fully tamed with strong employment levels. We highlight that forecasts are just predictions, and that the FRB members track record of forecasting is mixed at best.
Figure 1: Summary of Federal Reserve Board Members Economic Projections (MWG Highlight)
Source: Federal Reserve Board
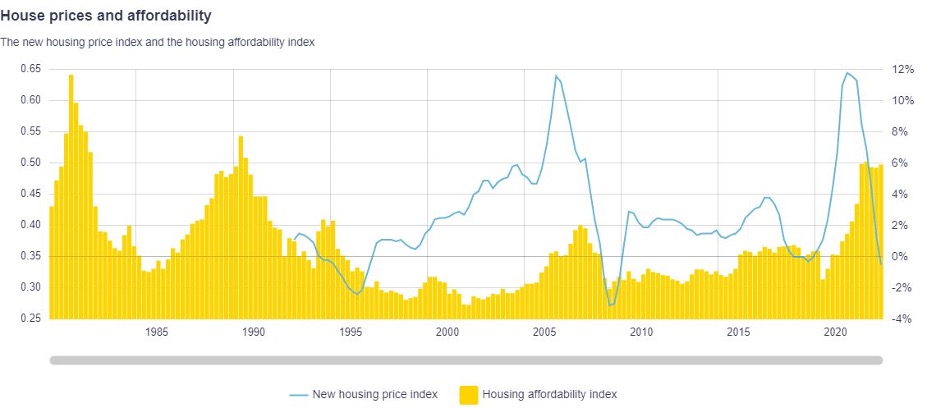
At this point, the effects of higher rates are not being fully felt by consumers and businesses with fixed rate borrowings negotiated at low rates. The increase in rates should start to influence household spending going forward, particularly in Canada, as mortgage renewals lead to a doubling of mortgage payments for many borrowers. This lag is the primary reason we believe Central Banks should proceed cautiously. Figure 2 provides the BoC Housing Affordability index (the yellow bars correspond to the left axis and denote the % of income needed to service a new mortgage on new home purchase). Housing affordability is at its worst level since the early 1990s, which preceded a large correction. Affordability will likely improve when interest rates subsequently decline, or incomes rise at a faster rate than housing prices, but the speed at which affordability corrects is yet to be determined.
Figure 2: Bank of Canada Housing Affordability Index
Source: Bank of Canada
At The Murray Wealth Group, we evaluate potential portfolio holdings on the basis of their earning power. In so doing, we strive to own companies that can increase their earnings per share through re-investment in their business, not those that solely benefit from inputs such as low interest rates or commodity prices. In short, we look for business plans that endure through the different economic cycles.
GLOBAL EQUITY GROWTH FUND
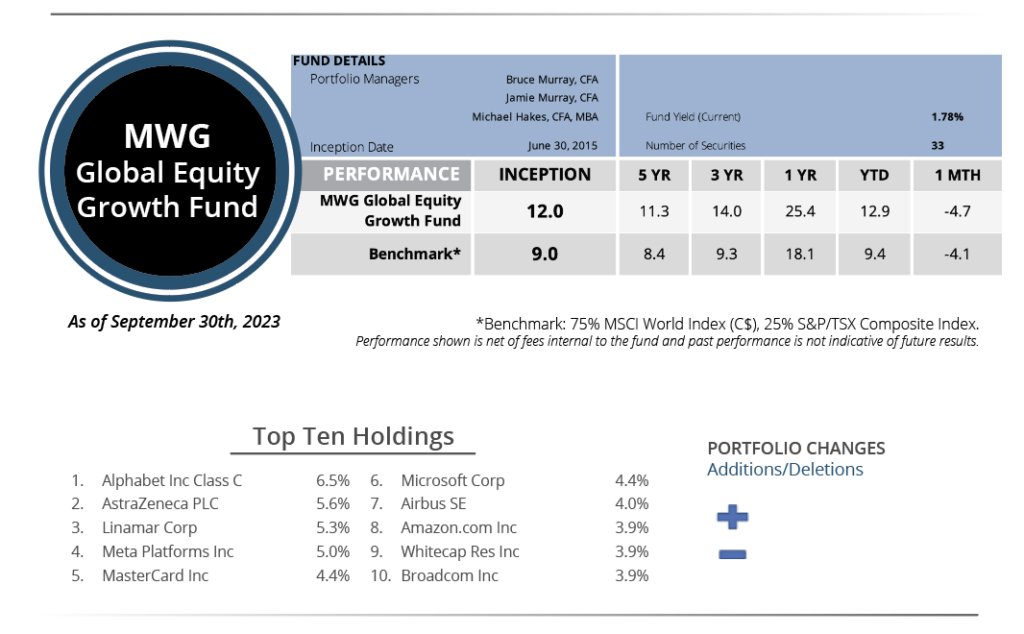
The MWG Global Equity Growth Fund fell 4.7% in September, more than the -4.1% return for its benchmark. Year-to-date, the Fund has returned 12.9% versus the benchmark return of 9.3%. The Fund’s top three performers in the month were United Health Group (+6.1%), Whitecap Resources (+4.2%) and BP PLC (+4%), while Raytheon Corp (-16.4%), Air Canada (-15%), and Target (-12.7%) were the biggest detractors.
We made no portfolio changes to this Fund in September.
INCOME GROWTH FUND
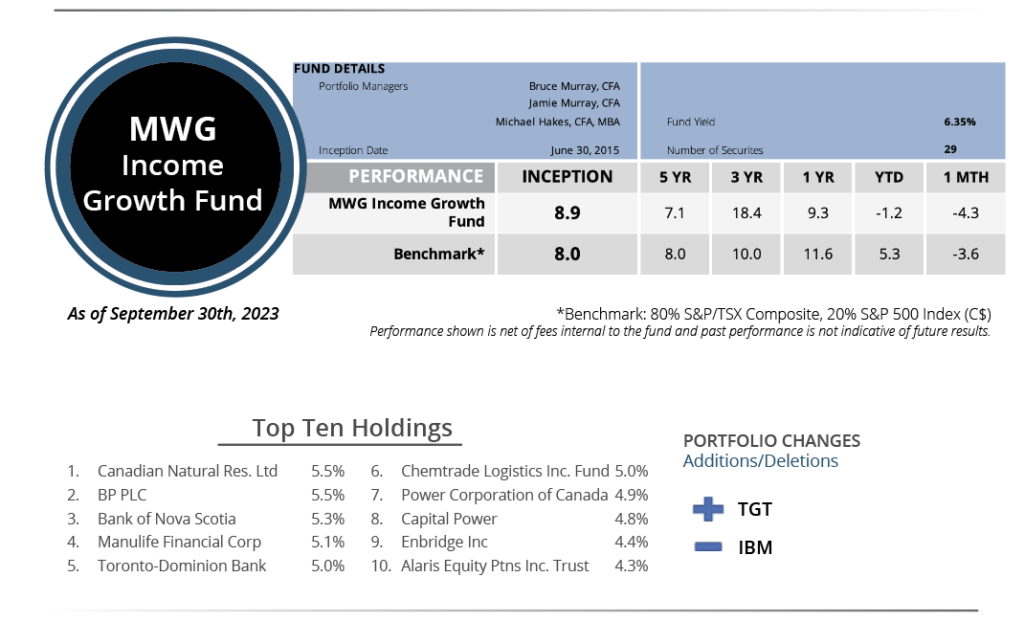
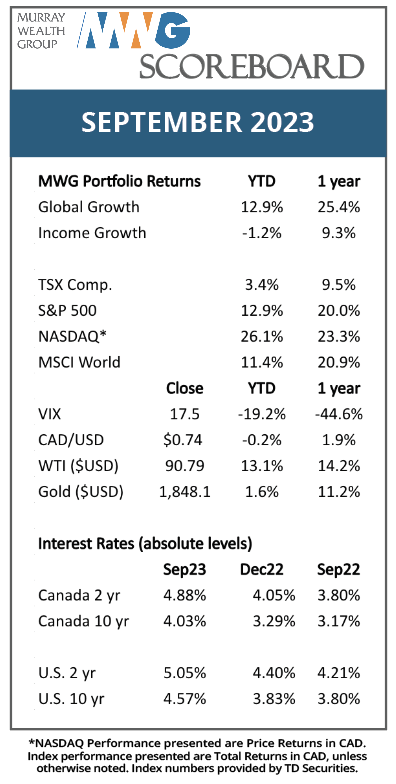
The MWG Income Growth Fund fell 4.3% in September versus the 3.6% decrease for its benchmark. The Fund is down 1.2% year-to-date versus the benchmark increase of 5.3%. Whitecap Resources (+4%), BP PLC (+4%) and Rio Tinto (+2%) led the portfolio, while Northwest Healthcare Properties REIT (-25%), Aegis Brands (-23%), and American Hotel Income Properties (-21%) were the top detractors. The fund yield was 6.35% at month’s end.
During the month we added share of retailer Target to the Income Growth Fund. We had previously bought shares in the Global Equity Growth Fund earlier this year as the retailer rebounded from high inventory levels and a shift away from durable goods towards experiences and travel in 2022. We believe margins are at trough levels and that the multiple should expand as same-store-sales growth turns positive. The shares are down 60% from their 2021 high and trading back at 2019 levels. We added the company to the Income Growth Fund as the dividend yield is now greater than 4%. In addition, the company reduces its share count by about 2.5% every year through share buybacks.
To fund the purchase of Target, we sold our position in IBM, as the shares approached our target price. We initially purchased the stock in early 2022.
This Month’s Portfolio Update is written by our Head of Research, Jamie Murray, CFA.
The purpose is to provide insight into our portfolio construction and how our research shapes our investment decisions. As always, we welcome any feedback or questions you may have on these monthly commentaries.

