After years of stimulus and low interest rates, the Federal Reserve has tightened its monetary policy. This has shortened investor time horizons and brought into focus current profitability versus future profitability. When capital is cheap and abundant (e.g., 2021), hurdle rates tend to be lower and companies can easily raise funds. This can result in an environment where companies have a long leash in terms of demonstrating profitability and cash flow. Many companies used this environment to grow at any cost and with no regard to profitability. With capital now more restricted, companies that exercised poor capital discipline may now find themselves lacking capital and needing to rethink their business models. Read
Category Archives: Market Insights
MWG Focus Stock: ERES
European Residential REIT

European Residential REIT (ERES) is a newer addition to the MWG Income Growth Fund, with a 4% weighting. We owned a prior edition of the REIT (one with a commercial focus) in 2019, exiting our investment after an acquisition/restructuring by CAP REIT, a large Canadian multi-family REIT that owns 66% of ERES units. We added the name back to the portfolio as the REIT emerged with a new strategy focused on multi-residential units in the Netherlands. We believe there are several tailwinds that should benefit the units. Read
February Focus: The Ukraine Invasion, History and the Stock Market Impact
The Ukraine Invasion, History and the Stock Market Impact
This war is a human tragedy and breaks the world order that has held since the end of WW2, as did the Korean War and Vietnam War. All these wars were fought on the edges of the East/West political divide.
Ukraine has been part of the East for all of modern history until the removal of the last Russian puppet president, Viktor Yanukovych in 2014. Restoring a Russian puppet has been Putin’s focus for the last decade. His population is also suffering from a rapidly declining standard of living, and he must distract them. Russia spends 4.3% of its GDP on the military, the third-highest globally and ahead of the U.S at 3.7%. This has punished the population’s standard of living. Guns or Butter is the economic expression for this and refers to a governments’ allocation of military spending versus civilian spending. Putin may end up like Gorbachev, with an economy crushed by military spending and a very unhappy population. Putin’s only hope is Vodka and its tempering the enthusiasm for protest. Putin does have higher oil prices, decent foreign reserves and perhaps a supportive China on his side. Read
October Focus Stock – ATZ
|
|
Aritzia has been a core holding in our Global Equity Growth portfolio for the past 18 months, having increased our position to a 4% target weighting from 2% during the depths of the pandemic. The position has performed particularly well in the past year with the shares up 125%. We have always been fans of Aritzia, first adding the name in the fourth quarter of 2018, and summarized our investment thesis in May 2019, when we highlighted the benefits of Aritzia’s direct-to-consumer (DTC) approach and its U.S. expansion opportunity.
Two years and a pandemic later, Aritzia’s U.S. expansion strategy is playing out stronger than expected. First off, the pandemic has accelerated the adoption of eCommerce, with Aritzia’s DTC operations benefitting from this shift. Secondly, its brand strength, balance sheet and the fact that it is “under-stored” allows the company to stay on offence while other large mall retailers are on the ropes. This combination of factors helped Aritzia grow first half FY22 U.S. revenue 73% from the same period two years ago. eCommerce revenue increased 169% over that timeframe.We can evaluate Aritzia’s brand strength using Google Trends. Google Trends benchmarks weekly search activity to the highest level in a selected period. Figure 1 shows the 3-year trend for U.S. Google searches. The two spikes in the middle represent Black Friday searches in 2019 and 2020, indicating peak search interest in Aritzia. Interestingly, recent U.S. search activity has trended towards levels close to Black Friday even though Aritzia has not had any promotional activity in 2021. We believe this indicates increased interest in the brand and expect searches on 2021 Black Friday to achieve record levels.
Figure 1. Aritzia United States Search Trends (Oct 2018-Oct 2021) |
MWG Focus Stock: MDI-TSX
Major Drilling Group International
MWG Focus Stock: Zalando
Zalando and the eCommerce Department Store
Zalando (ZLNDY) is a leading European ecommerce apparel company with 39 million active customer accounts that should generate sales with a Gross Market Value (GMV) of EUR14B in 2021. The customer value proposition revolves around Zalando offering a vast assortment of brands and products and provides an easy shopping experience that includes delivery and return of unwanted items. This value proposition and the company’s broad European reach have made Zalando the starting destination for fashion in Europe, with operations in 27 countries. Figure 1 demonstrates Zalando’s leadership and growth in active customer accounts. Read
MWG Focus Stock: CTS.TO
Converge Technology Solutions
We initiated a 1% position in Converge Technology Solutions (CTS.TO) in the Global Equity Growth Portfolio in June. Converge is executing a roll-up acquisition strategy, buying independent IT Service Providers (ITSPs) across North America. ITSPs help end users implement and manage technology solutions such as software, hardware, and servers from the original vendors (e.g., Microsoft or IBM), as well as ongoing managed services like analytics and cybersecurity. Read
MWG Focus Stock: DLTR
The buck starts here…
Dollar Tree (DLTR) is the second-largest operator of discount variety stores across North America, offering a range of basic and seasonal goods. The company’s brands include Dollar Tree and Family Dollar, split between roughly 15,000 locations. This is our second round owning DLTR stock (we will refer to the corporate company as DLTR to distinguish it from its store brand). We previously exited in early 2019 as management failed to execute on its post-merger strategy after acquiring the Family Dollar brand in 2015. Ingrained in the DLTR culture at the time was a commitment to the $1.00 price point, and despite showing a willingness to adopt a multi-price point strategy, the previous management was stubbornly slow to implement. This led to sluggish growth at Dollar Tree and unrealized synergies with the acquired Family Dollar stores. Read
MWG Focus Stock: AMZN
Amazon is about to make a lot of money…
Amazon is a customer-centric company that strives to make life easy and convenient for customers. Although well known as an online retailer and e-commerce site, Amazon’s other business units are increasingly driving the profitability of the company. We believe Amazon is on the cusp of an explosion of profitability that will drive the share price higher. Read
MWG Focus Stock: CCO
The return of Nuclear Power and Cameco
Global electricity demand is expected to grow by 50% over the next 30 years. This demand, when combined with growing societal pressure to remove carbon from the atmosphere, will be a challenge for the world. Read
MWG Focus Stocks: Going Digital
Digital Rent is Due!
A big investment theme for the next decade is the shift to digital living from physical. We are learning that we can complete many tasks more effectively through computing intermediaries. Remote meetings and online conferences eliminate travel and commercial space requirements, telehealth provides safe and quick access to medical professionals, and perhaps the largest category, e-commerce allows us to shop an unlimited selection of goods from our couch. Read
MWG Focus Stock: ADS
Alliance Data Systems: Let’s get this Bread!*
Alliance Data Systems (ADS) is a provider of retailer loyalty solutions, most prominently through its white-label credit card program and the Air Miles rewards program in Canada. Let’s be honest – Alliance Data Systems has not been a stellar performer in the Global Equity Growth Fund. We originally purchased the shares in 2018, with our sights set on a turnaround through the streamlining of the business. However, its core business deteriorated more than we anticipated, and the pandemic-driven closure of physical retailers negatively impacted the company’s 2020 earnings. Entering 2021, we are encouraged by the improving physical retail environment as well as steps the company has taken to strengthen its strategic position. These have involved a renewed focus on growing with online retailers, hiring an outsider CEO and, most importantly, the acquisition of Buy Now, Pay Later (BNPL) company “Bread”. Read
Our 2021 Outlook
The recovery progresses.
We believe economic activity will start to normalize in summer 2021 with multiple vaccines demonstrating efficacy in building immunity to Covid-19. Global GDP has already recovered to pre-Covid levels, although the composition has changed with a higher contribution from technology and consumer goods versus services. Morgan Stanley estimates point to strong rebounds through 2022, with GDP growth moving above its previous trendline. Read
MWG Focus Stock: UNH
UnitedHealth Group: Let the Healing Begin

MWG Focus Stock: STLC
Stelco: We built this city!

MWG Focus Stock: IRSG
Domo Arigato, Mr. Roboto.

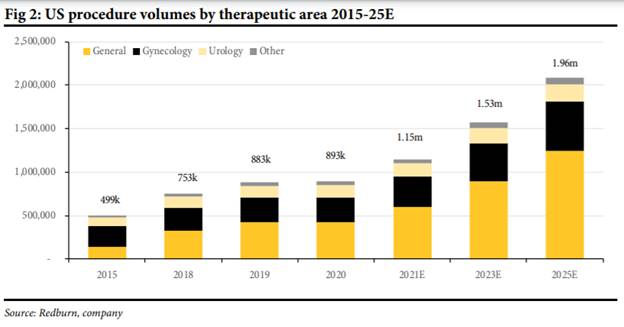
Intuitive Surgical is a leader of robotic surgical systems (you can find more information here). While robotic surgery sounds futuristic, Intuitive’s systems have been used for over 20 years. In 2019, its systems were used in almost 900,000 surgeries. Robotic surgery provides for increased precision, faster recoveries, and lower risk of complications as well as less stress on surgeons. Its growth revolves around increasing market share through the sale of additional devices, the increased training of surgeons, and the expansion of the type of surgeries that can be performed robotically. The company is extremely profitable, with a razor/razorblade model. Once the units are placed on-site, they generate ongoing instrument sales and service revenue. Read
Time To “Check-in” on the Aircraft Travel Market
This week, Airbus, one of the world’s largest commercial aircraft manufacturers, announced a lowering of its expectations for aircraft deliveries due to the weak travel market. With the Coronavirus pandemic grounding global air travel, driving affected equities down 50-70% from their pre-COVID highs, it’s worth revisiting the sector to see if there is opportunity to invest for a rebound. In this piece, we will examine the issues at hand to see which factors are the most significant in figuring out when or if a rebound can be expected. Read
Is This Tech Bubble 2.0?
There is a lot of talk comparing the current market to that of 1999-2000. True, technology is eating the world, and while the current outlook for further penetration is favourable, the same arguments could have been made about the millennium market (the dawn of smartphones, expanding internet access, better compute efficiency). However, we believe there are substantial differences that make today’s sector much more defensive. As the world entered the new century, there was fear (Y2K) that the large base of installed computer and communications systems was not programmed to handle the new millennium. This was accompanied by the rapid rise of the internet and a plethora of new issues based on ideas for how to use the internet. Many went to large valuations without any real business traction. We also saw a complete rebuild of the world’s communications networks, with a shift from copper to fibre transmission, which led to massive overcapacity. Nortel peaked at about 35% of the S&P/TSX. Read
Twilio: Enabling Communication Anywhere
Netflix: The Opportunity Beyond Hollywood
Less than a decade ago, Netflix embarked on the international expansion of its eponymous video-on-demand streaming service, a significant shift from its DVD-by-Mail strategy that had delivered more than one billion DVDs to its members. Netflix’s success can be evidenced by its revenue growth, rising from US$2.2B in 2010 to US$20.2B in 2019. At the heart of this growth is the Flywheel strategy it uses to perpetuate its growth. Read
What’s Happening in the Oil Market?
Monday’s large market sell-off (S&P 500 Index down 3.3%) due to Coronavirus and U.S. Political concerns will be addressed in our February Portfolio Review next week. Our phone and email lines are always open if you have questions or would like to reach us personally.
What's Happening in the Oil Market?
After its fall in 2014 from US$100+, oil prices have bounced between US$40-70/barrel (bbl) save for a few peaks and dips outside of that range. CNBC Commentator Jim Cramer called for the death of oil last week on his show Mad Money, saying these companies are un-investable due to the acceleration of climate change and an increasing focus on ESG (Environmental, Safety and Governance) changing investment trends. Recently, Blackrock committed to doubling its ESG friendly ETF offering and shunning companies that derive more than 25% of revenue from coal.
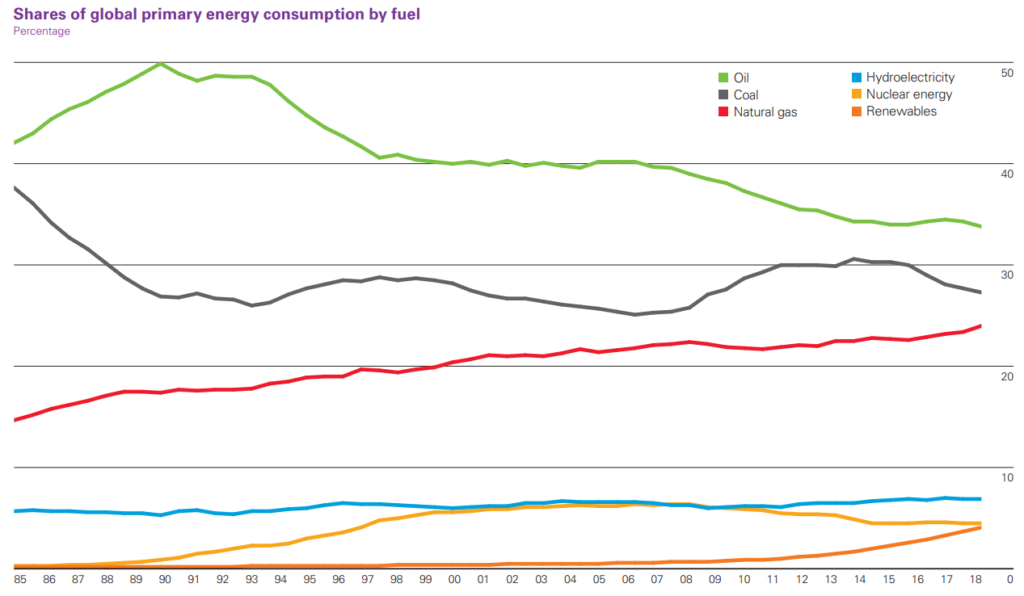
Oil and commodities are inherently cyclical. And while it’s true that oil is being replaced by other forms of cleaner energy, this trend has been ongoing for several decades. In 1990, oil consumption represented half of global energy consumption. Today, with millions of more cars on the road, global oil consumption is about 40% higher than it was in 1990, but down dramatically as a percent of total energy consumption to 34%.
Figure 1: Shares of Global Primary Energy Consumption by Fuel

As noted above, while oil’s market share is declining, its absolute consumption is not. In 2018, consumption reached 100 million barrels of oil per day, a 1.5% increase year over year and an acceleration from the 1.0% average growth rate from 2007-2017.
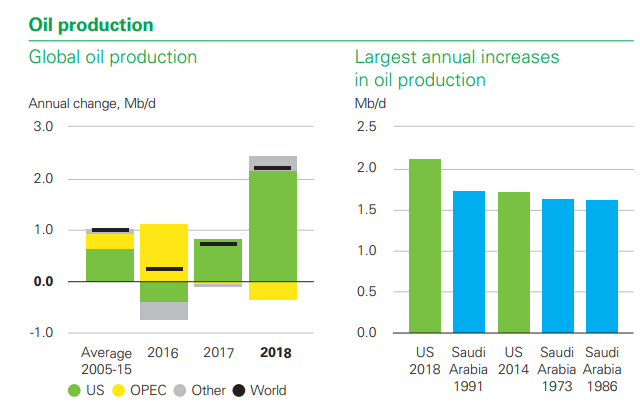
To understand oil prices, we must look to the supply side and marginal cost. As can be seen in Figure 2, U.S. supply grew quickly from 2005-2015 before falling in 2016 as drilling activity fell, following but lagging the 2014 oil price correction. When oil prices rose, U.S. production responded quickly, with the U.S. adding a record 2.2 million bpd in 2018 (the largest increase in a year for a single country).
Figure 2: Global Oil Production Growth

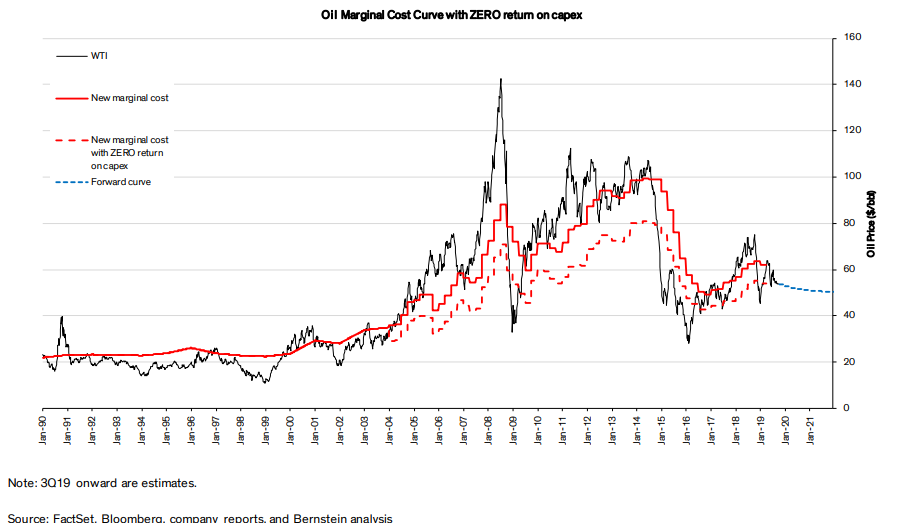
It is widely accepted that North American oil, particularly U.S. shale, is currently the marginal barrel of oil produced. According to Bernstein Research, the current marginal cost of oil is about US$60, slightly above current prices. Below marginal cost, producers are not incentivized to grow oil production. Assuming there is insufficient supply capacity below the marginal cost (i.e. some new large oil discovery that can be produced more efficiently than U.S. shale), we should see prices appreciate from here to spur drilling that will be required to meet growth in demand.
Figure 3: Marginal Cost of Oil VS Oil Price

Valuation.
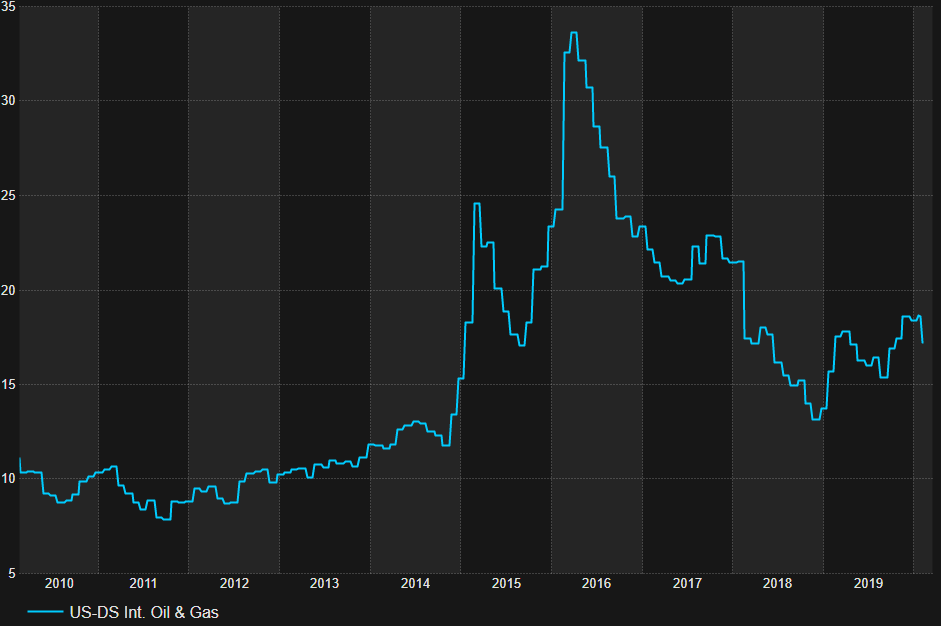
Two common valuation metrics for oil companies are the ratio of price to earnings or cash flow and a more technical discounted cash flow based on the company’s reserves and a forward price assumption (Net Asset Value or “NAV”). Both are commonplace but investors currently seem focused on near-term earnings/cash flow metrics. As shown below, the U.S. peer group is trading at a P/E multiple of approximately 17.5 times. This is actually a premium to multiples experienced earlier this decade (cash flow metrics showed a similar relationship), although we note that multiples tend to fall when oil prices significantly exceed the marginal cost, and valuations across equities are much higher today than they were in 2010-2013.
Figure 4: Composite P/E Ratio for U.S. Oil Exploration & Production Companies

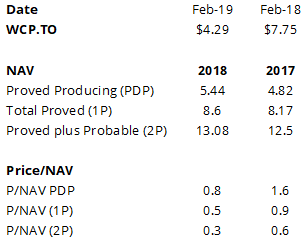
On a NAV basis, valuations are much less demanding as the market has started to place discounts on corporate reserve values. We’ll use a former market darling in Canada, Whitecap Energy, as an example. In Feb 2019, the company reported the following NAV values. At the time, its share price was $4.29.
Figure 5: Price/NAV for Whitecap

*NAV’s estimate the future value of a company’s reserves and are subject to geological estimations and future commodity prices. Reserves are categorized as follows: Proved reserves have a 90% chance of recovery. PDP – from producing wells, 1P – includes undeveloped reserves (i.e. future drilling), 2P – 50% chance of recovery.
Historically, Canadian oil companies have traded in line or at a premium to NAV based on proved and probable reserves (2P NAV as shown in the table above). For example, in 2014, Whitecap’s average share price was about $14.20 compared to a 2P NAV of $13.33. In 2015, following the oil price correction, investors started to place discounts on reserve values, essentially indicating they would not assign value to future production and cash flow, and thus oil stocks started trading more on the basis of proved producing reserves (PDP). At a P/NAV of 0.8x based on PDP, investors were indicating that the cash flow value of Whitecap’s currently producing wells (i.e., if the company did not drill another well ever) should be discounted at a rate higher than the standard 10% used by industry engineers.
Putting It All Together.
Tesla Inc. shares have tripled since the summer of 2019, indicating that the market is looking at a major shift in consumer behaviour with accelerated electric vehicle adoption in the near term. However, despite the excitement around electric vehicles, oil demand continues to increase. Oil cycles are shortening with advances in shale drilling, which enables a faster supply response.
We believe there’s a chance for an uptick in the oil market short term as the rate of decline in global base production is increasing as a result of constrained capital spending on the part of producers. However, higher oil prices (and gasoline prices) will serve to accelerate any shift to electric vehicles as economics shift to EVs. With more investors shying away from hydrocarbons due to ESG and other increasing anti-oil social pressures, it is difficult to see a re-rating of oil equities unless we see a change in sentiment.
This is the eighteenth in a series of independent research produced by the Murray Wealth Group Research Team.
The purpose of this series is to provide insight into our portfolio construction and how our research shapes our investment decisions.
We welcome any feedback or questions you may have on these monthly commentaries.
2020 Outlook
Market Priced Higher; Watch the Fed; Tech Continues to Eat the World; Five BOLD Predictions.
Lessons from Silicon Valley
Facebook’s Asian Opportunity
That in itself is not shocking. We are familiar with successful Chinese firms like Tencent (WeChat), ByteDance (TikTok), Alibaba and Baidu, Japan’s Softbank (how’s that WeWork IPO coming along?) and Indonesia’s GrabCar (essentially an Asian-version of Uber and motorbikes). However, the products and services of technology firms from the West remain very relevant for Asian businesses and consumers. Read
IBM: Signs of a turnaround afoot
Recession Watch 2019
What are indicators saying?
Recessions are almost impossible to predict. Consider these three headlines:
“US could go into recession this year: Expert”
“There’s more than 60% chance of a global recession within the next 18 months, economist says”
“The bond market’s recession signal may be wrong this time”
The year from each respective headline – In order: April 2015, April 2017 and July 2018. Read
Trade War Times: Where to Invest
The current trade war between China and the United States represents both a headwind for global economic growth and an overhang in the equity markets. A myriad of factors has driven the U.S. and China to this point, but there are two main issues that the U.S. Government is targeting: its large trade deficit with China, as well as concerns surrounding the transfer of intellectual property, state secrets and technology through espionage. Read
Midsummer Musings
This is the fourteenth in a series of independent research produced by the Murray Wealth Group Research Team. The purpose of this series is to provide insight into our portfolio construction and how our research shapes our investment decisions. We welcome any feedback or questions you may have on these monthly commentaries.
This piece is written by our CEO and CIO, Bruce Murray.
Midsummer Musings
While the American stock markets have recently broken through to all-time highs, we continue to see prognosticators fighting for seats atop the ‘Wall of Worry’.
“This is the longest economic expansion in history.”
“We are at full employment; therefore, inflation must be just around the corner.”
“The tariff wars have killed trade.”
On the other hand, Larry Fink of Blackstone believes that the U.S. public is underrepresented in equities despite the solid liquidity of the U.S. consumer.
Market Research #13: Antitrust
Antitrust Coming to Big Tech
This is the thirteenth in a series of independent research produced by the Murray Wealth Group Research Team. The purpose of this series is to provide insight into our portfolio construction and how our research shapes our investment decisions. We welcome any feedback or questions you may have on these monthly commentaries.
This piece is written by our Head of Research, Jamie Murray.
On May 31, The Wall Street Journal broke the news of the opening of an investigation into four of the most prominent technology companies: Alphabet, Amazon, Apple, and Facebook. The action is bi-partisan supported and thus ‘big tech’ won’t be able to lean on its friends in Washington for sanctuary. We own positions in all four companies in our Global Growth Portfolio as we are attracted to the technology sector’s appealing fundamentals (secular growth, strong margins, low capex/high cash flow). As owners, we are keenly interested in gauging the likely outcome of each company’s investigation and determining the risks and opportunities available.
Market Research #12: Aritzia
Aritzia: wide open space for U.S. growth
This is the Twelfth in a series of independent research produced by the Murray Wealth Group Research Team. The purpose of this series is to provide insight into our portfolio construction and how our research shapes our investment decisions. We welcome any feedback or questions you may have on these monthly commentaries.
Aritzia is a Canadian women’s fashion retailer positioned at the upper end of the mass consumer market. The company has a strong footprint in Canada with 67 locations, and a growing presence in the United States with 25 stores located in both shopping centers and other urban shopping destinations. Aritzia designs and sells exclusive inhouse brands, including TNA, Wilfred, and Babaton, and carries select products of leading designers such as Adidas. The company enjoys high satisfaction amongst the coveted 20-40 year-old women’s demographic. It is positioned above larger fashion retailers like H&M and The Gap but well below European luxury designers in terms of price, brand perception and quality. We believe Aritzia is a best-in-class fashion retailer, with a long runway of growth in the United States, trading at a reasonable valuation.